Source-first digest for monthly 2026_05 rank 3, rank_id p003.
- Routing status:
success - PDF extraction: not used
Motivation / Background
The paper targets a gap in document visual question answering evaluation. Existing Doc-VQA benchmarks mostly score whether the final text answer is correct, but they do not verify whether the answer is grounded in the exact source region that supports it. The authors argue that this is unsafe in legal, finance, medical, and other audit-heavy document settings, because a model can produce the right answer while citing the wrong table, paragraph, page, or visual element.
CiteVQA changes the task definition: a model must output both an answer and element-level bounding-box citations. A response is useful only if a human can visually verify the answer against the cited source regions. Figure 1 shows the task framing, dataset position, and the gap between answer accuracy and Strict Attributed Accuracy.
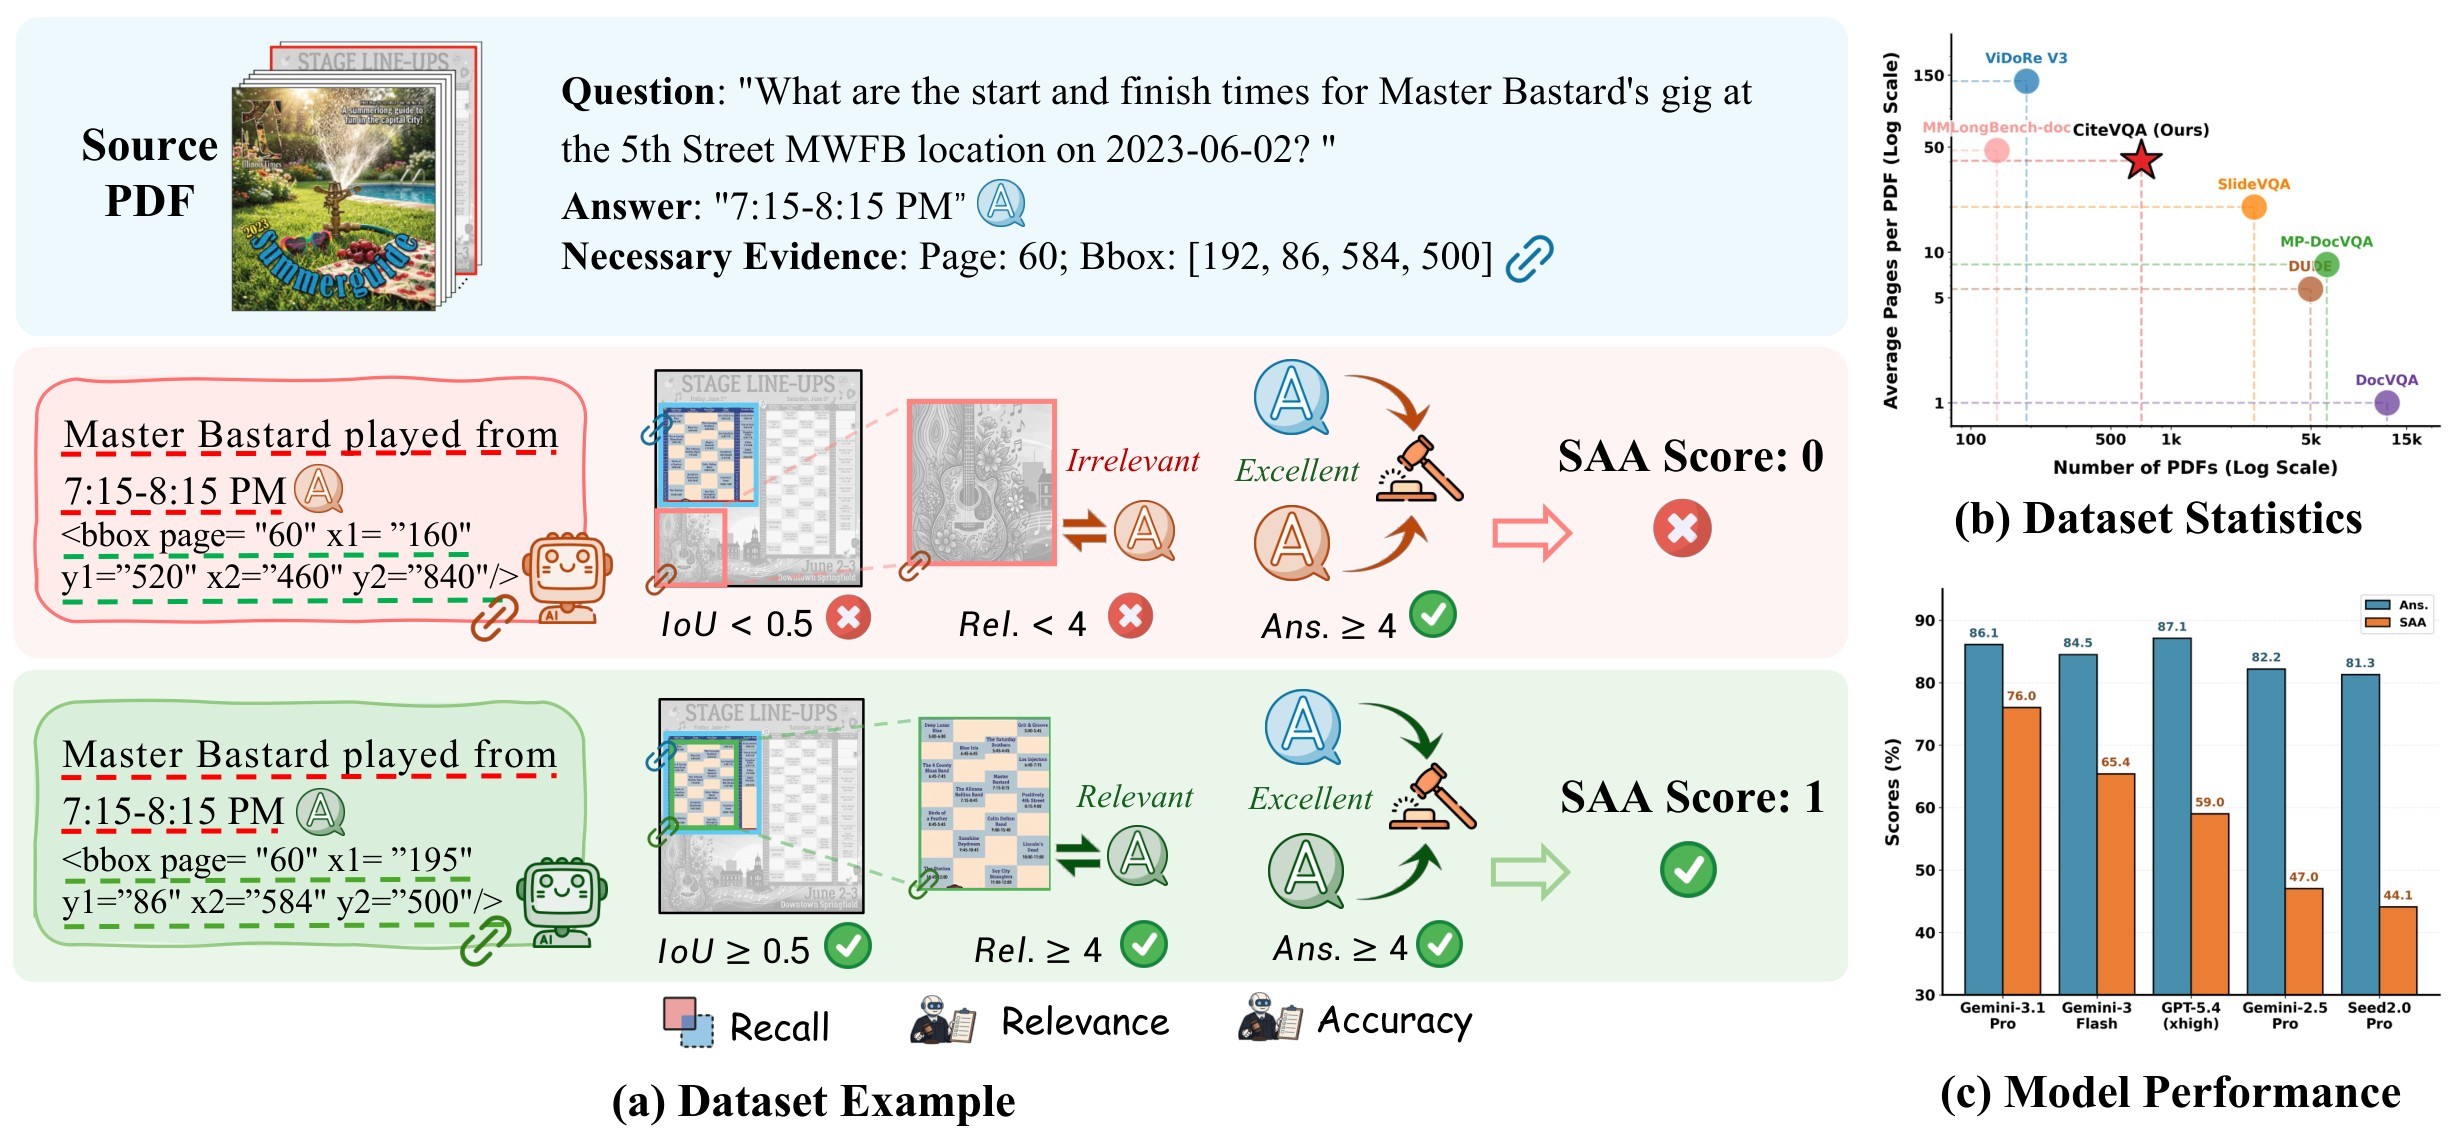
The benchmark is also positioned against prior document VQA resources in Table 1. The main difference is not raw document count; it is the combination of long documents, element-level evidence, and joint answer-plus-citation scoring.
| Benchmark | Documents | Average pages | Evidence granularity | Joint answer/evidence metric |
|---|---|---|---|---|
| DocVQA | 12,767 | 1.0 | Page | No |
| InfoVQA | 5,485 | 1.0 | Page | No |
| MP-DocVQA | 6,000 | 8.3 | Page | No |
| MMLongBench-Doc | 135 | 47.5 | Page | No |
| SlideVQA | 2,619 | 20.0 | Block | No |
| ViDoRe V3 | 190 | 137.0 | Block | No |
| CiteVQA | 711 | 40.6 | Element | Yes |
Table 1. Benchmark comparison. This digest table is copied from the source benchmark-comparison table and normalized to plain text labels. CiteVQA is smaller than single-page VQA datasets but tests longer, more realistic documents and element-level traceability.
Claims And Evidence
| Claim id | Main claim | Support | Evidence anchors |
|---|---|---|---|
| C1 | Answer-only Doc-VQA metrics miss an important failure mode: correct text paired with wrong evidence. | 5 | problem framing, attribution hallucination results, case studies |
| C2 | CiteVQA provides a realistic evidence-attribution benchmark: 1,897 questions over 711 PDFs, seven domains, two languages, and long multi-page documents. | 5 | dataset statistics, question distribution figure |
| C3 | The annotation pipeline is scalable and structured enough to generate element-level citations, using document linking, evidence package extraction, QA templating, verification, and evidence ablation. | 4 | pipeline overview, pipeline details, expert audit |
| C4 | Strict Attributed Accuracy (SAA) is a strong audit metric because it only credits a sample when the answer is correct and the supporting citation is either relevant or localized. | 5 | metric equations, main results |
| C5 | Current MLLMs show severe attribution hallucination: top systems can answer well, but their SAA and evidence recall remain much lower. | 5 | main results table, coarse localization analysis, case studies |
| C6 | Better localization appears to help answer correctness, but the paper's evidence is correlational and ablation-based rather than a causal training intervention. | 4 | attribution and accuracy analysis, search-space ablation |
| C7 | CiteVQA is costly to reproduce and evaluate because it relies on strong MLLMs, coordinate-level checking, and high-resolution document inputs. | 4 | experiment setup, resolution sensitivity, limitations |
Support scores are support-from-paper scores, not independent reproduction scores. A score of 5 means the claim is directly backed by the paper's definitions, tables, or experiments; a score of 4 means the paper presents substantial evidence but still depends on its automated pipeline, judge setup, or internal ablations.
Core Technical Idea
The core idea is to treat trustworthy document VQA as a joint answer and citation problem. Each sample is represented as \((D, Q, A_{\text{gt}}, \mathcal{B}_{\text{gt}})\), where \(\mathcal{B}_{\text{gt}}\) is the set of ground-truth evidence boxes. The crucial subset \(\mathcal{B}_{\text{crucial}}\) is identified by masking ablation: if masking a box prevents a strong model from answering correctly, the box is labeled crucial.
The main localization metric is crucial-evidence recall at IoU@0.5:
Relevance and answer correctness are judged on 0-5 scales:
The headline metric, Strict Attributed Accuracy, is binary at the sample level:
This definition matters because it gives models two routes to attribution credit. They can cite regions that overlap crucial evidence, or they can cite regions judged semantically relevant, but they still need a correct answer. The supplementary metrics in Table 2 separate page navigation, box precision, and localization F1.
| Metric | What it checks | Formula or decision rule | ||||
|---|---|---|---|---|---|---|
| Page recall | Whether the model reached the right evidence page at all | \(\text{Page.} = \frac{ | \{p \in \mathcal{P}_{\text{crucial}} \mid \exists \hat{p} \in \mathcal{P}_{\text{pred}}, \hat{p}=p\} | }{ | \mathcal{P}_{\text{crucial}} | }\) |
| Precision | Whether predicted boxes avoid irrelevant evidence | \(\text{Prec.} = \frac{1}{ | \mathcal{B}_{\text{pred}} | } \sum_{b_{\text{pred}}} \mathbf{1}_{(\max_{b_{\text{gt}}} \text{IoU}(b_{\text{pred}}, b_{\text{gt}}) \ge 0.5)}\) | ||
| F1 | Localization balance between recall and precision | \(F_1 = 2 \cdot \frac{\text{Prec.}\cdot\text{Rec.}}{\text{Prec.}+\text{Rec.}}\) |
Table 2. Supplementary localization metrics. These metrics explain whether a model fails because it cannot find the page, cannot draw tight boxes, or produces many irrelevant citations.
Method Details
The benchmark construction pipeline has five major stages. Figure 2 is the paper's overview: documents are linked, parsed into evidence packages, converted into QA tasks through templates, verified, and reduced to crucial evidence through ablation.
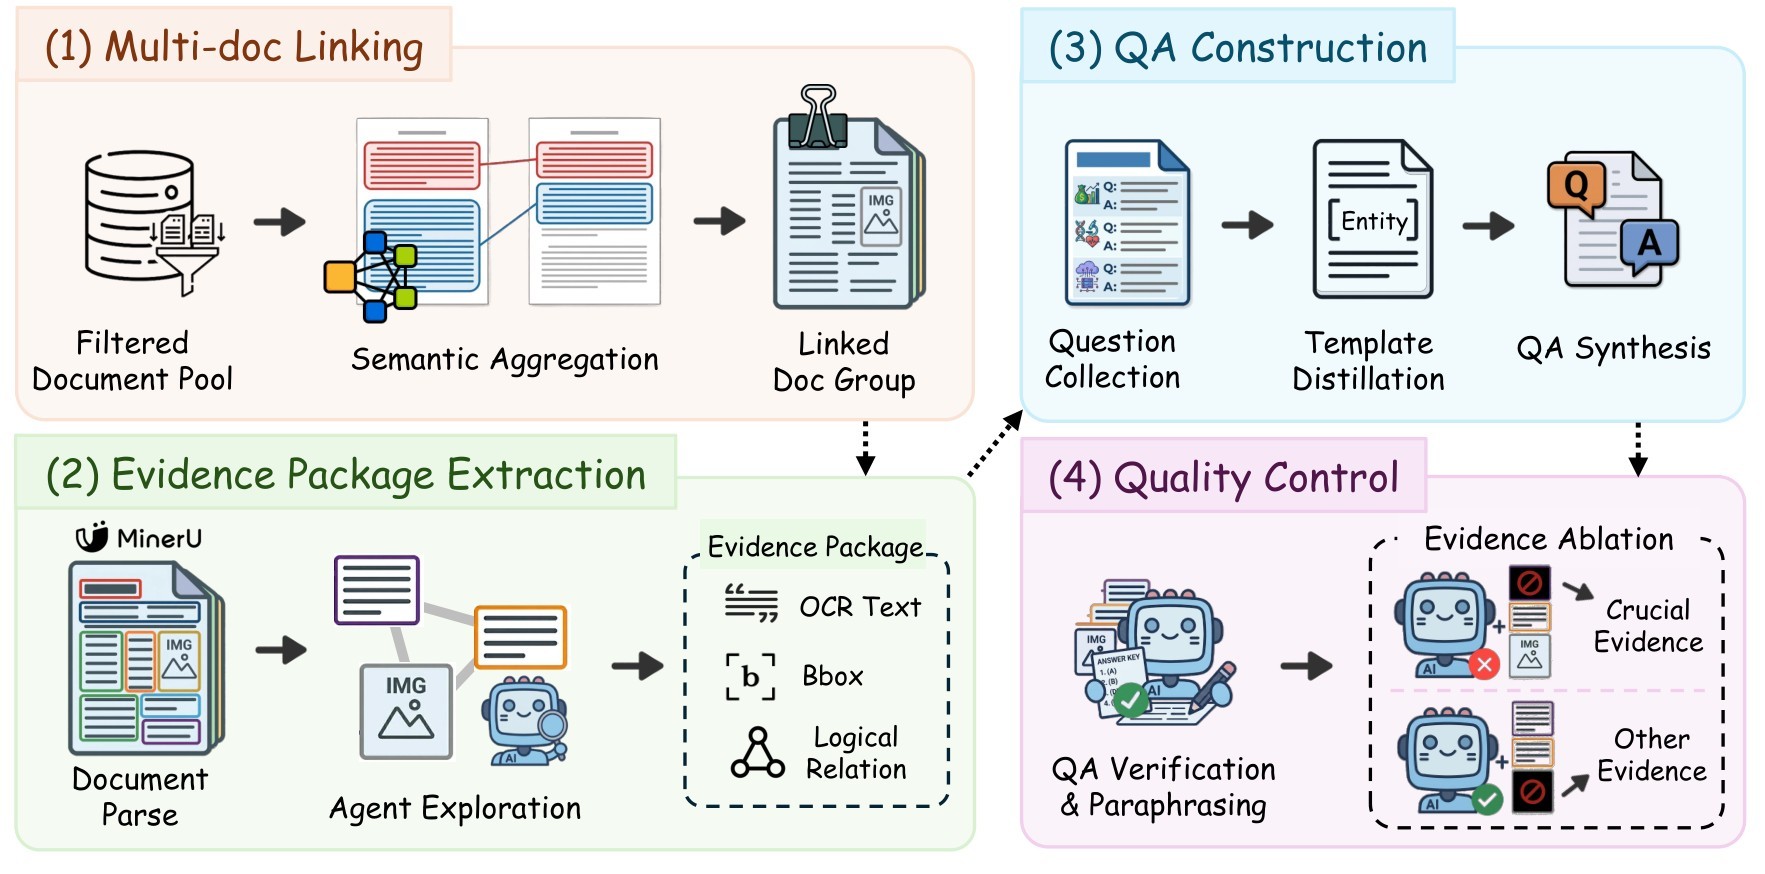
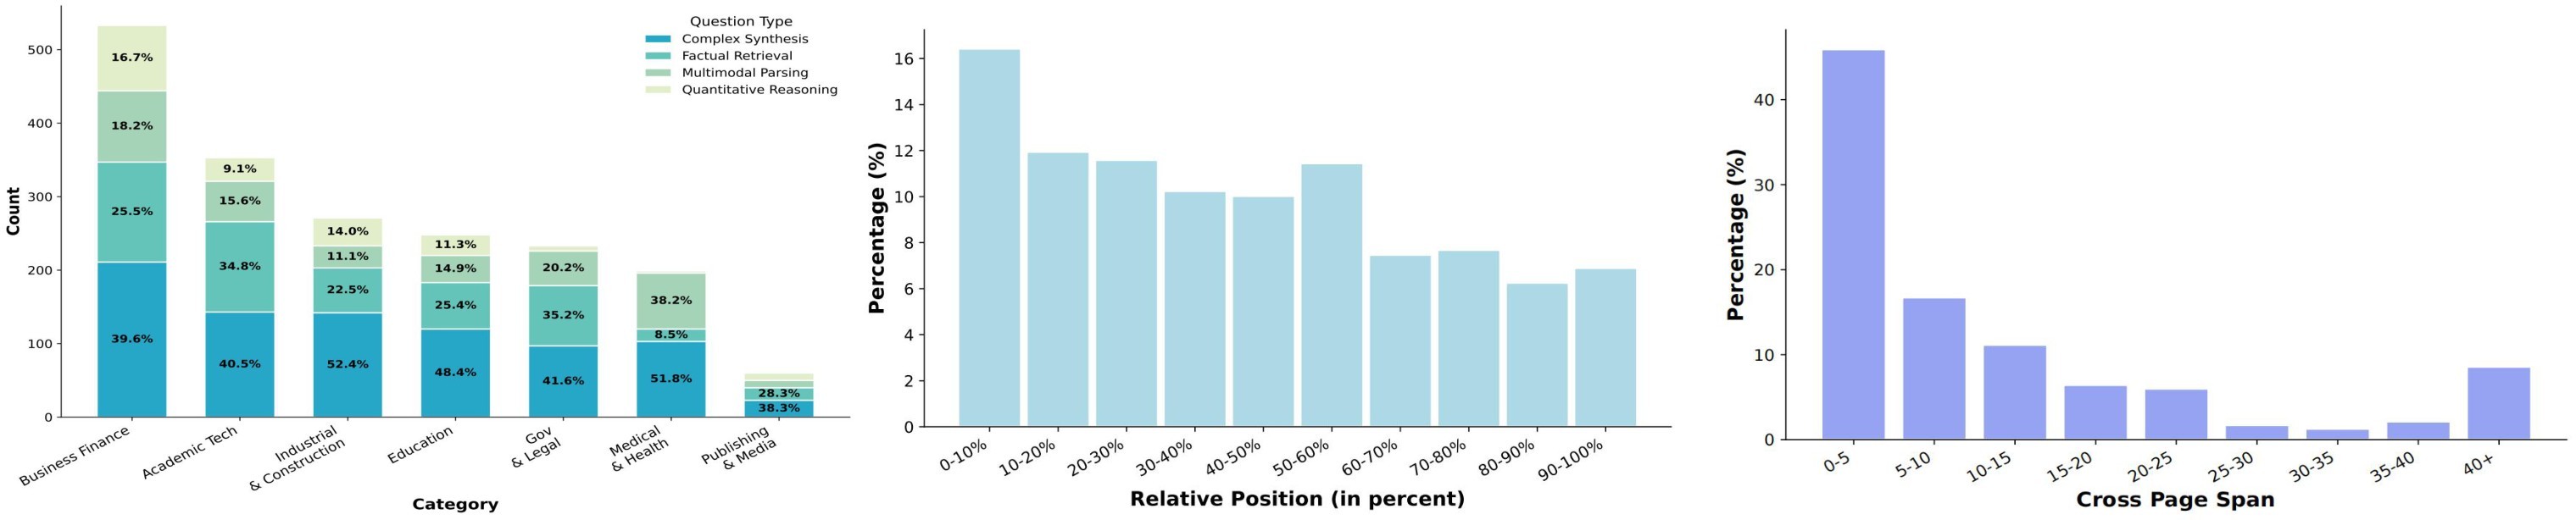
Table 3 captures the benchmark scale. The most important facts for a reader are that the average document is 40.6 pages, 48% of questions are multi-document, and nearly 30% of cited evidence is non-textual.
| Statistic | Value |
|---|---|
| Documents | 711 |
| Macro / micro document types | 7 / 30 |
| Average / median pages | 40.6 / 30.0 |
| Language split, EN / ZH | 451 / 260 |
| Total questions | 1,897 |
| Single-doc questions | 987 (52.0%) |
| Multi-doc, one gold document | 487 (25.7%) |
| Multi-doc, multiple gold documents | 423 (22.3%) |
| Complex synthesis questions | 839 (44.23%) |
| Factual retrieval questions | 499 (26.30%) |
| Multimodal parsing questions | 352 (18.56%) |
| Quantitative reasoning questions | 207 (10.91%) |
| Evidence source: text / table / image / equation | 70.12% / 21.99% / 7.04% / 0.84% |
| Average / max evidences per question | 2.57 / 10 |
Table 3. CiteVQA dataset statistics. This table is copied from the source statistics table and reformatted for the digest.
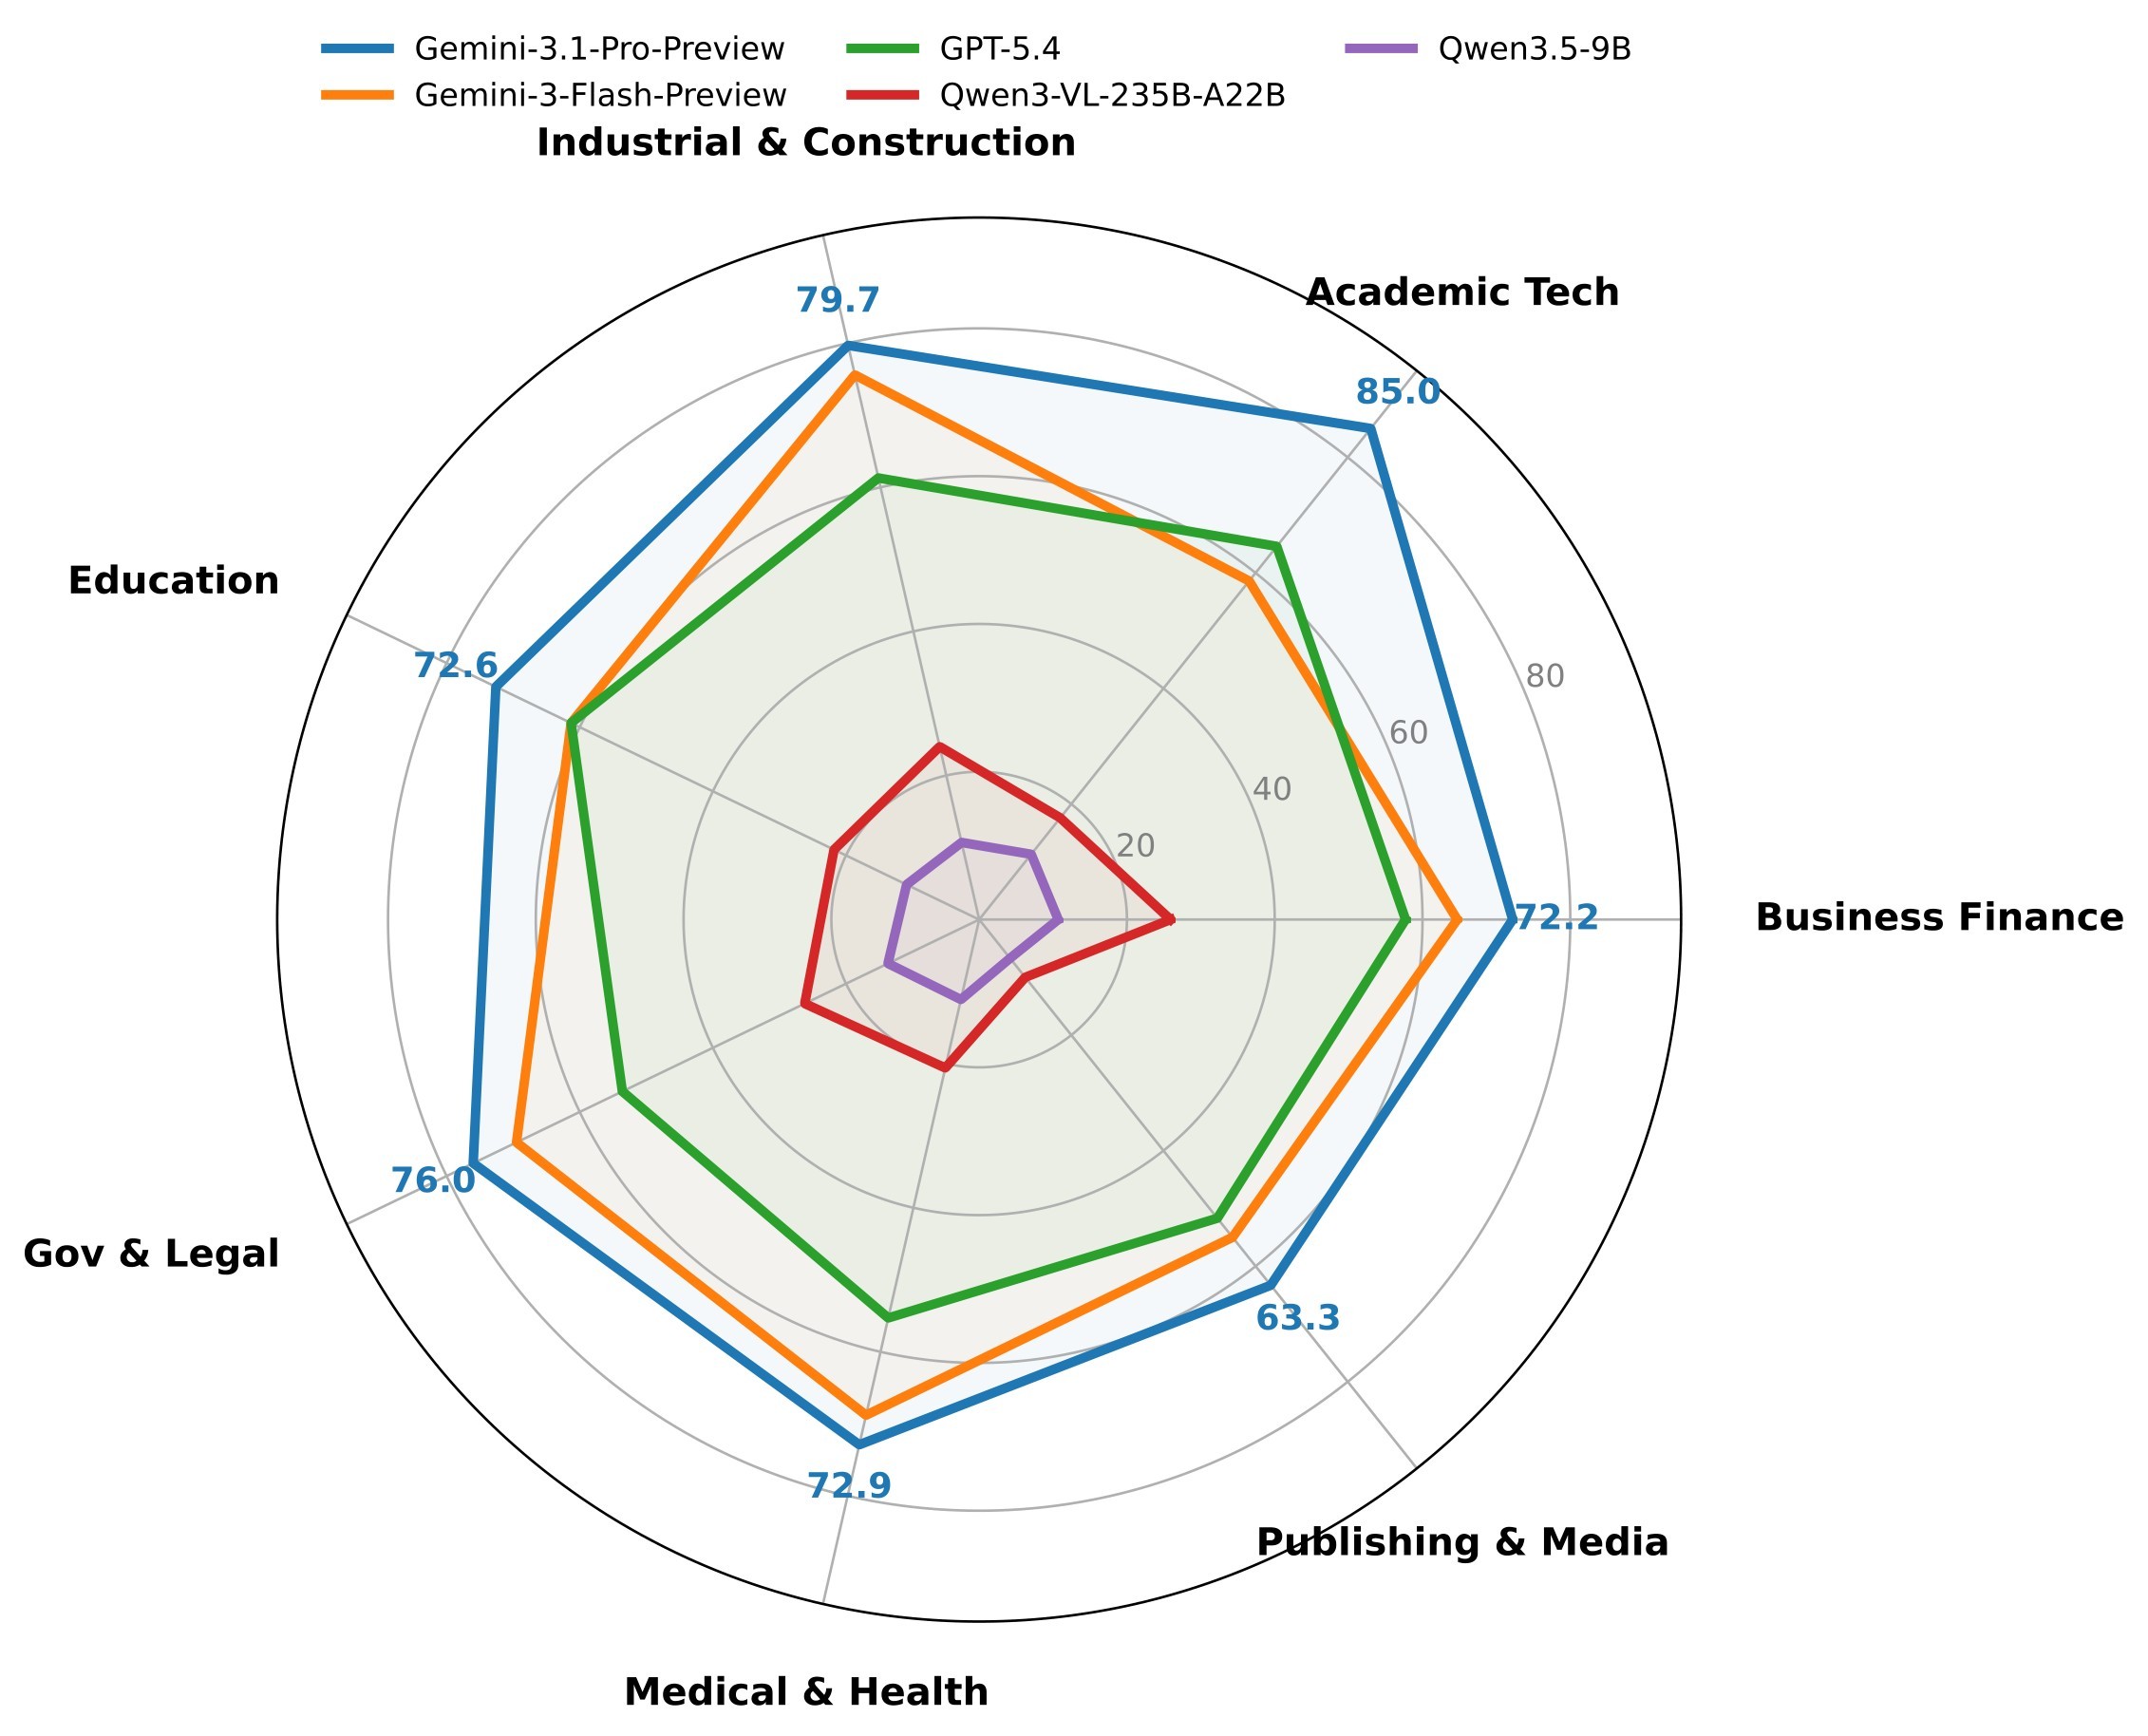
Figure 3 is the visual counterpart to Table 3. It matters because it shows the benchmark is not just a set of text-span retrieval tasks: it includes domain-specific question mixes, evidence locality variation, and cross-page evidence spans.
The pipeline starts from more than 100 million raw PDFs, preselects roughly 250k candidates, then uses a two-stage MLLM annotation process for coarse domain/language classification and fine-grained subcategory classification. The final benchmark keeps 711 documents across seven domains and 30 subcategories.
For multi-document tasks, each document receives a semantic profile containing high-level metadata such as document type, core thesis, and section units. Dense retrieval selects the top \(K_{\text{doc}}=5\) candidate documents for an anchor. An LLM then performs section-level matching and returns up to five association groups, each with one to three related segments. When matched pages are assembled into a synthetic multi-document workspace, the paper keeps a bijective mapping \(f_{\text{map}}\) back to the original PDF coordinates so synthesized evidence remains traceable.
Evidence extraction uses MinerU2.5 to produce document IDs, page numbers, bounding boxes, and OCR content. High-performance MLLM agents then navigate this parsed space to concatenate supporting facts into an Evidence Package. QA construction uses templates distilled from open-source datasets across academic technology, medical and health, business finance, industrial and construction, and government/legal domains.
Quality control has three layers. First, candidate QA pairs are retained only when a powerful MLLM can answer from the evidence screenshots alone. Second, a zero-document self-test using Qwen3-VL-235B-A22B discards questions answerable without document context. Third, evidence ablation masks each BBox element one at a time; a box becomes crucial evidence if masking it breaks answerability.
The paper adds two validation checks. A PhD-level expert audit of 200 sampled outputs reports human averages of 2.97 for difficulty, 4.43 for answer quality, and 4.91 for crucial-evidence quality on a 5-point scale. A separate auxiliary training validation uses 3k CiteVQA-generated samples from ViDoRe V3 PDFs and reports that the synthetic pipeline nearly reaches human-annotated training data performance in the AgenticOCR-style setup.
Experiments And Results
The evaluation covers 20 MLLMs across proprietary and open-source families. Gemini models use the native File API; long-context models use 150 DPI page screenshots; standard-context models downscale pages to at most \(1024 \times 1024\); GLM-5V-Turbo uses \(768 \times 768\). All models use a unified prompt with sampling temperature 1.0. Qwen3-VL-235B-A22B is the primary automated judge, and a 200-sample human study reports no statistically significant difference from automated judges for Rel. and Ans. scores.
Table 4 extracts the key overall rows from the paper's main results table. Rel. and Ans. are normalized to 100 by multiplying the original 0-5 scores by 20, matching the paper's table convention.
| Model | Overall Rec. | Overall Rel. | Overall Ans. | Overall SAA | Digest reading |
|---|---|---|---|---|---|
| Gemini-3.1-Pro-Preview | 66.0 | 83.6 | 86.1 | 76.0 | Best overall attribution and SAA |
| Gemini-3-Flash-Preview | 45.4 | 75.7 | 84.5 | 65.4 | Strong SAA but weaker localization than Gemini-3.1-Pro |
| GPT-5.4 | 31.0 | 67.5 | 87.1 | 59.0 | Best answer score, but lower attribution |
| Gemini-2.5-Pro | 27.4 | 59.8 | 82.2 | 47.0 | Solid answer accuracy, weaker citation grounding |
| Qwen3-VL-235B-A22B | 11.3 | 35.3 | 72.3 | 22.5 | Strongest open-source MLLM row in the paper |
| Qwen3-VL-32B | 6.6 | 30.5 | 72.3 | 17.3 | High answer score relative to low localization |
| Qwen3-VL-8B | 1.0 | 14.7 | 61.2 | 7.5 | Severe evidence-attribution failure |
Table 4. Key overall model results. The headline pattern is the gap between answer quality and evidence attribution. GPT-5.4 reaches 87.1 answer accuracy but only 59.0 SAA; Qwen3-VL-235B-A22B reaches 72.3 answer accuracy but only 22.5 SAA.
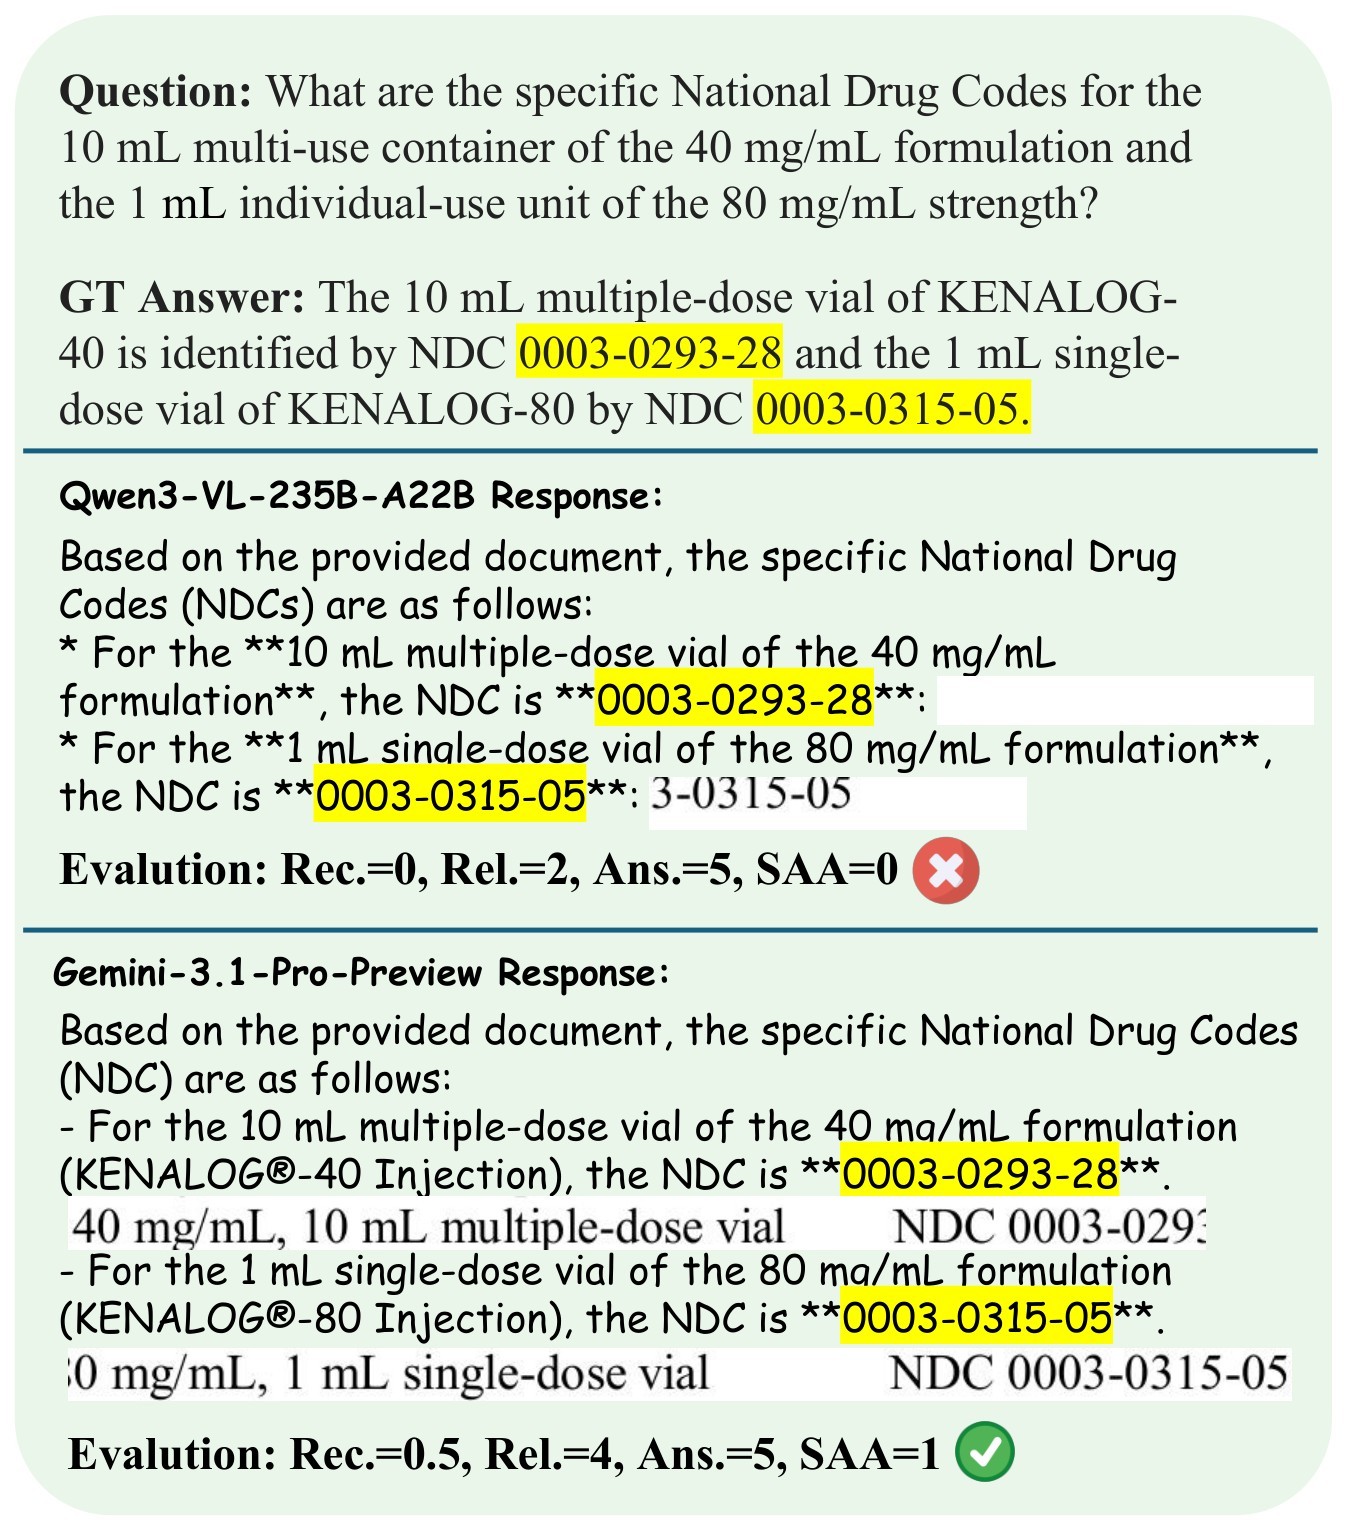
The authors call this gap Attribution Hallucination. It is not just a fine-grained bounding-box issue: the appendix reports that page-level recall is also low for many models, which means models often fail before precise box localization even begins.
Multi-document complexity worsens the problem. For Gemini-3.1-Pro-Preview, crucial-evidence recall falls from 68.9 in single-document tasks to 55.3 in multi-document, multi-gold tasks. The paper reports similar drops in page-level recall and F1 for advanced systems in multi-document scenarios, showing that cross-document navigation remains a hard frontier.
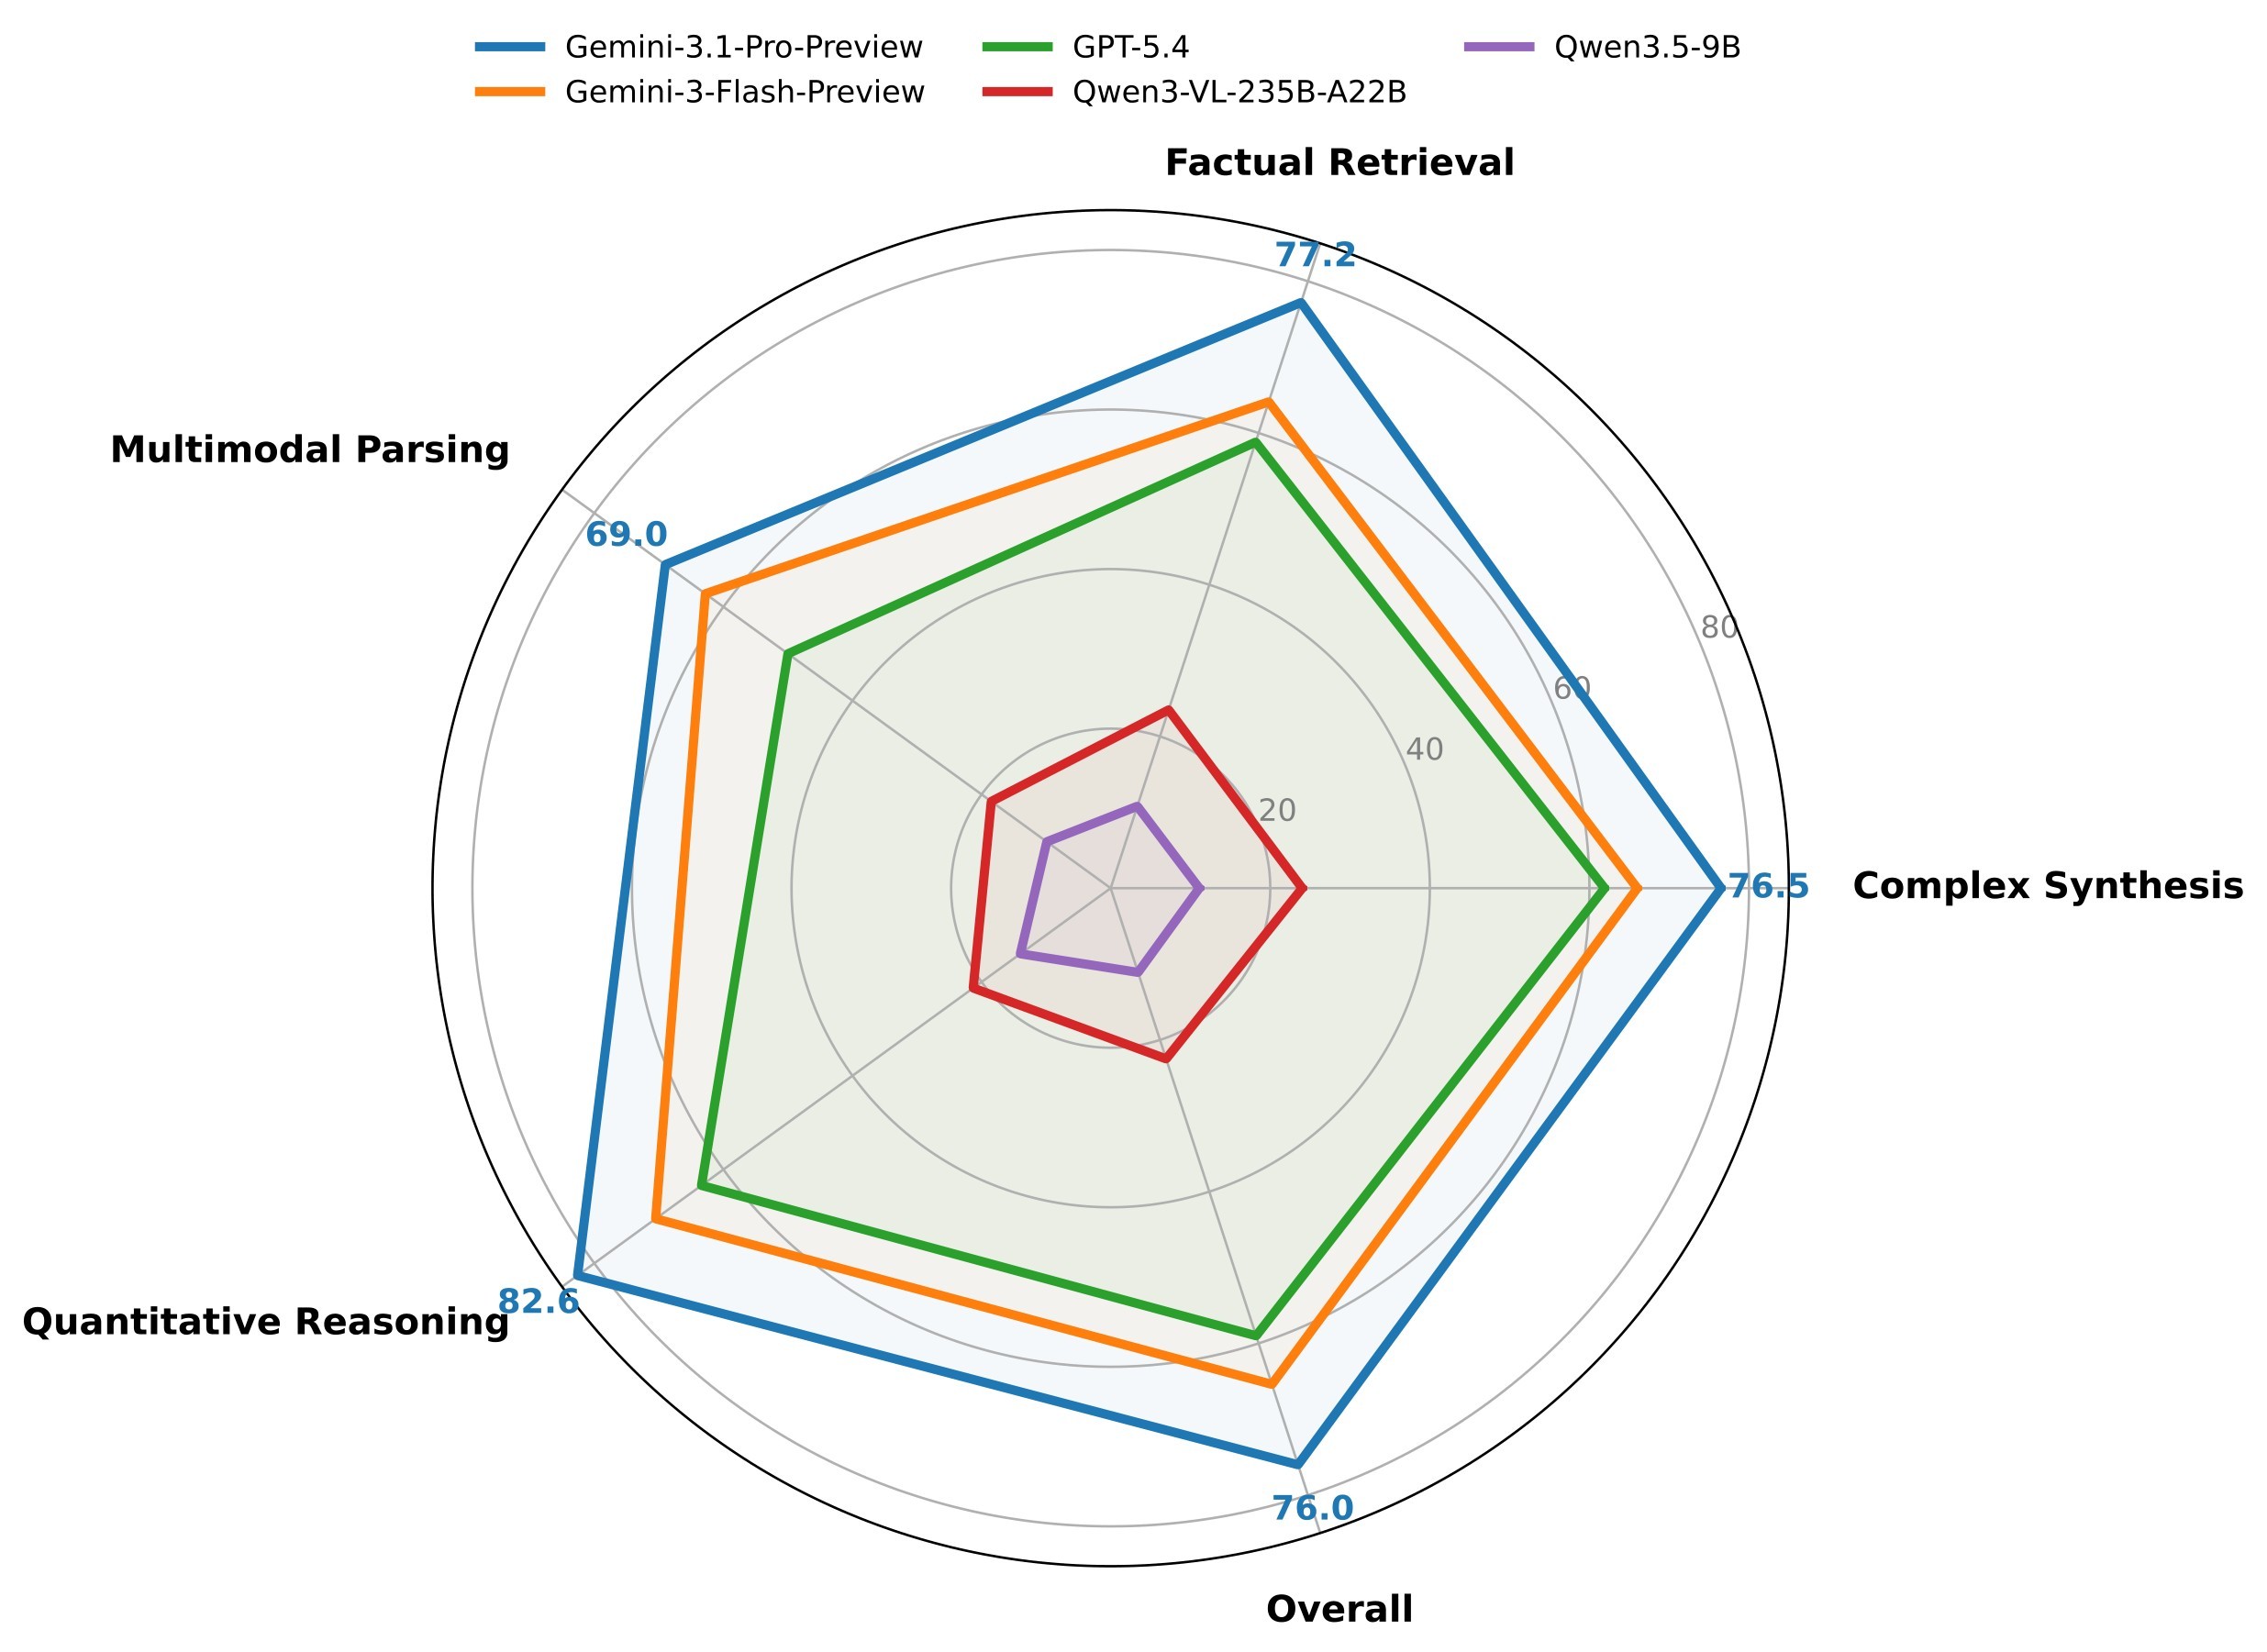
The paper also argues that evidence attribution is not merely a post-hoc explanation. After models leave the 0-30 evidence-quality region, answer accuracy tends to rise with \(\max(\text{Rel.}, \text{Rec.})\). The search-space ablations in Table 5 support that interpretation: when the model is given ground-truth pages or the gold document, answer scores improve.
| Model | Scenario | Base setting | GT page or gold-document setting | Gain |
|---|---|---|---|---|
| Qwen3.5-27B | Single-doc, GT pages | 79.3 | 84.6 | +5.3 |
| Qwen3-VL-32B | Single-doc, GT pages | 75.3 | 79.9 | +4.6 |
| Qwen3.5-9B | Single-doc, GT pages | 73.2 | 75.2 | +2.0 |
| Qwen3-VL-8B | Single-doc, GT pages | 67.0 | 71.1 | +4.1 |
| Qwen3.5-27B | Multi-doc, gold document | 73.1 | 81.6 | +8.5 |
| Qwen3-VL-32B | Multi-doc, gold document | 67.6 | 72.6 | +5.0 |
| Qwen3.5-9B | Multi-doc, gold document | 58.4 | 68.1 | +9.7 |
| Qwen3-VL-8B | Multi-doc, gold document | 53.3 | 66.7 | +13.4 |
Table 5. Search-space ablation. Narrowing the search space improves answer performance, especially for weaker models in multi-document settings. This is evidence that localization is a bottleneck, though not a full causal proof that better autonomous citation always improves reasoning.
Figure 5 gives the compact visual case study used in the main paper. It is the clearest intuition for why SAA is different from answer accuracy.
| Resolution strategy for Qwen3-VL-235B-A22B | Total pixels | Rec. | Rel. | Ans. | SAA |
|---|---|---|---|---|---|
| Full resolution | \(1024^2\) | 11.3 | 35.3 | 72.3 | 22.5 |
| Half-pixel scaling | \(1024^2 / 2 \approx 724^2\) | 4.2 | 23.6 | 66.8 | 11.8 |
| Quarter-pixel scaling | \(1024^2 / 4 = 512^2\) | 1.6 | 17.2 | 53.5 | 5.3 |
Table 6. Resolution sensitivity. Lowering image resolution moderately hurts answer accuracy but sharply collapses evidence attribution, so precise citation depends on visual fidelity.
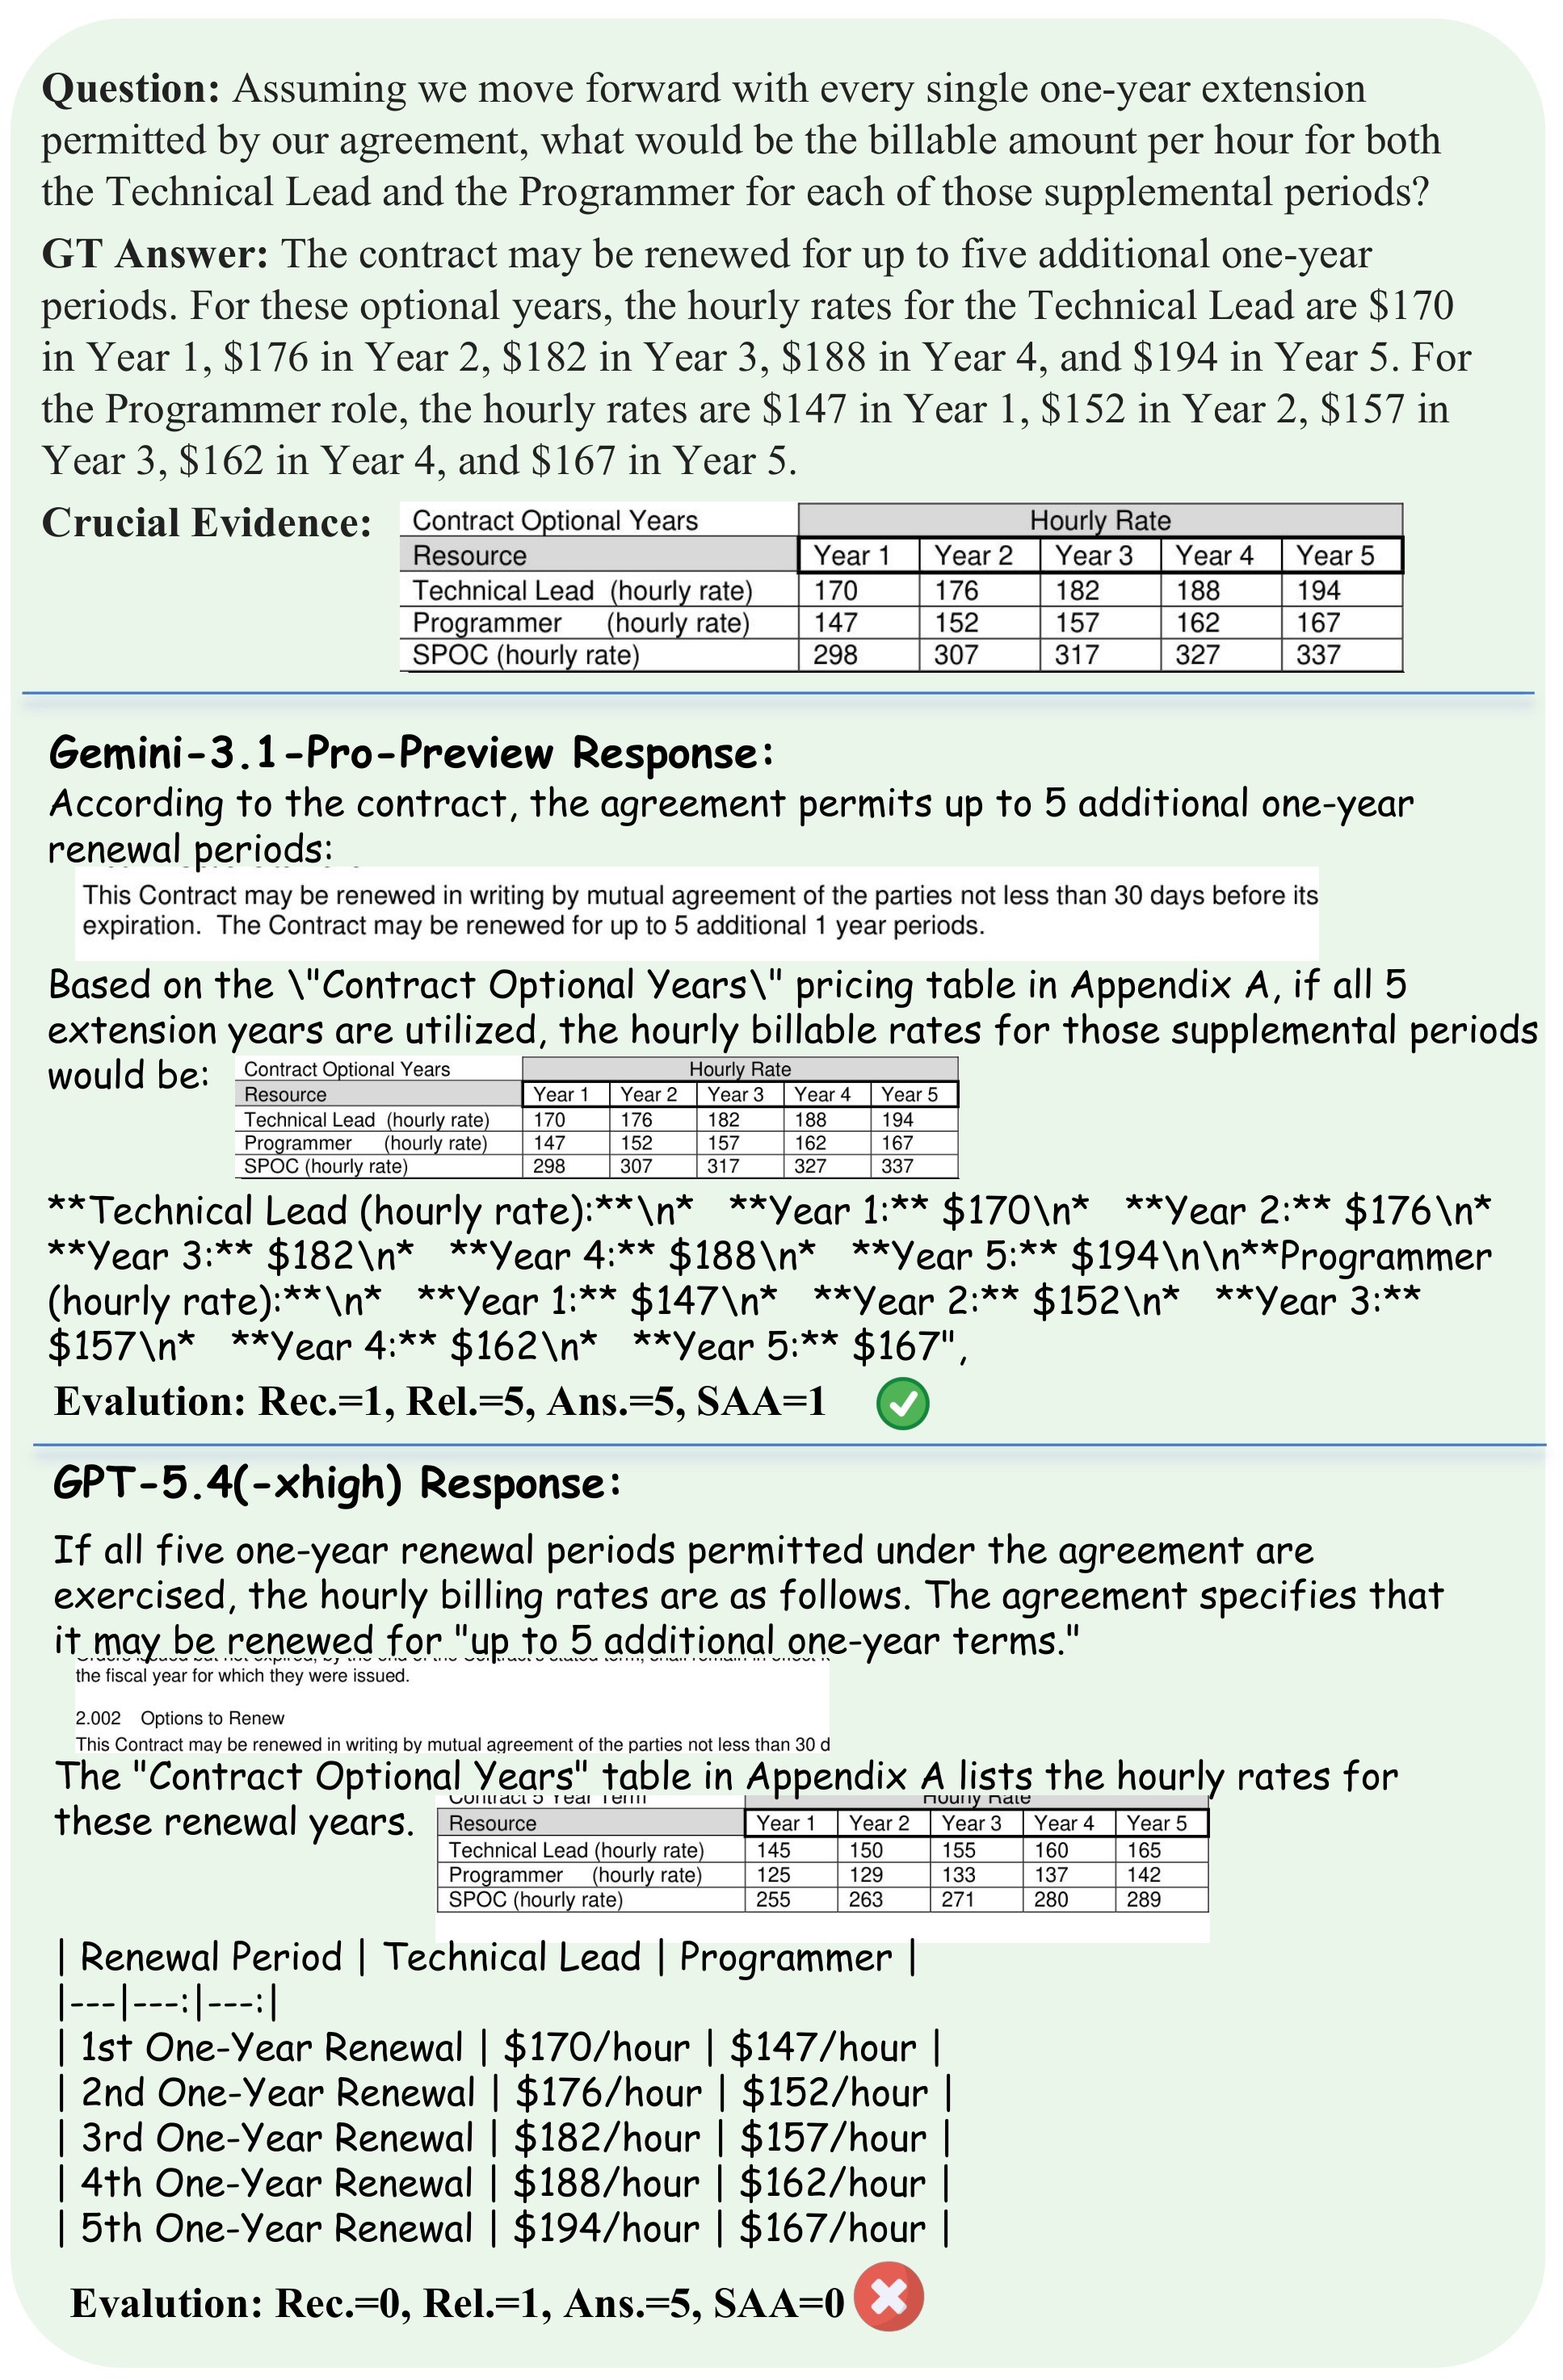
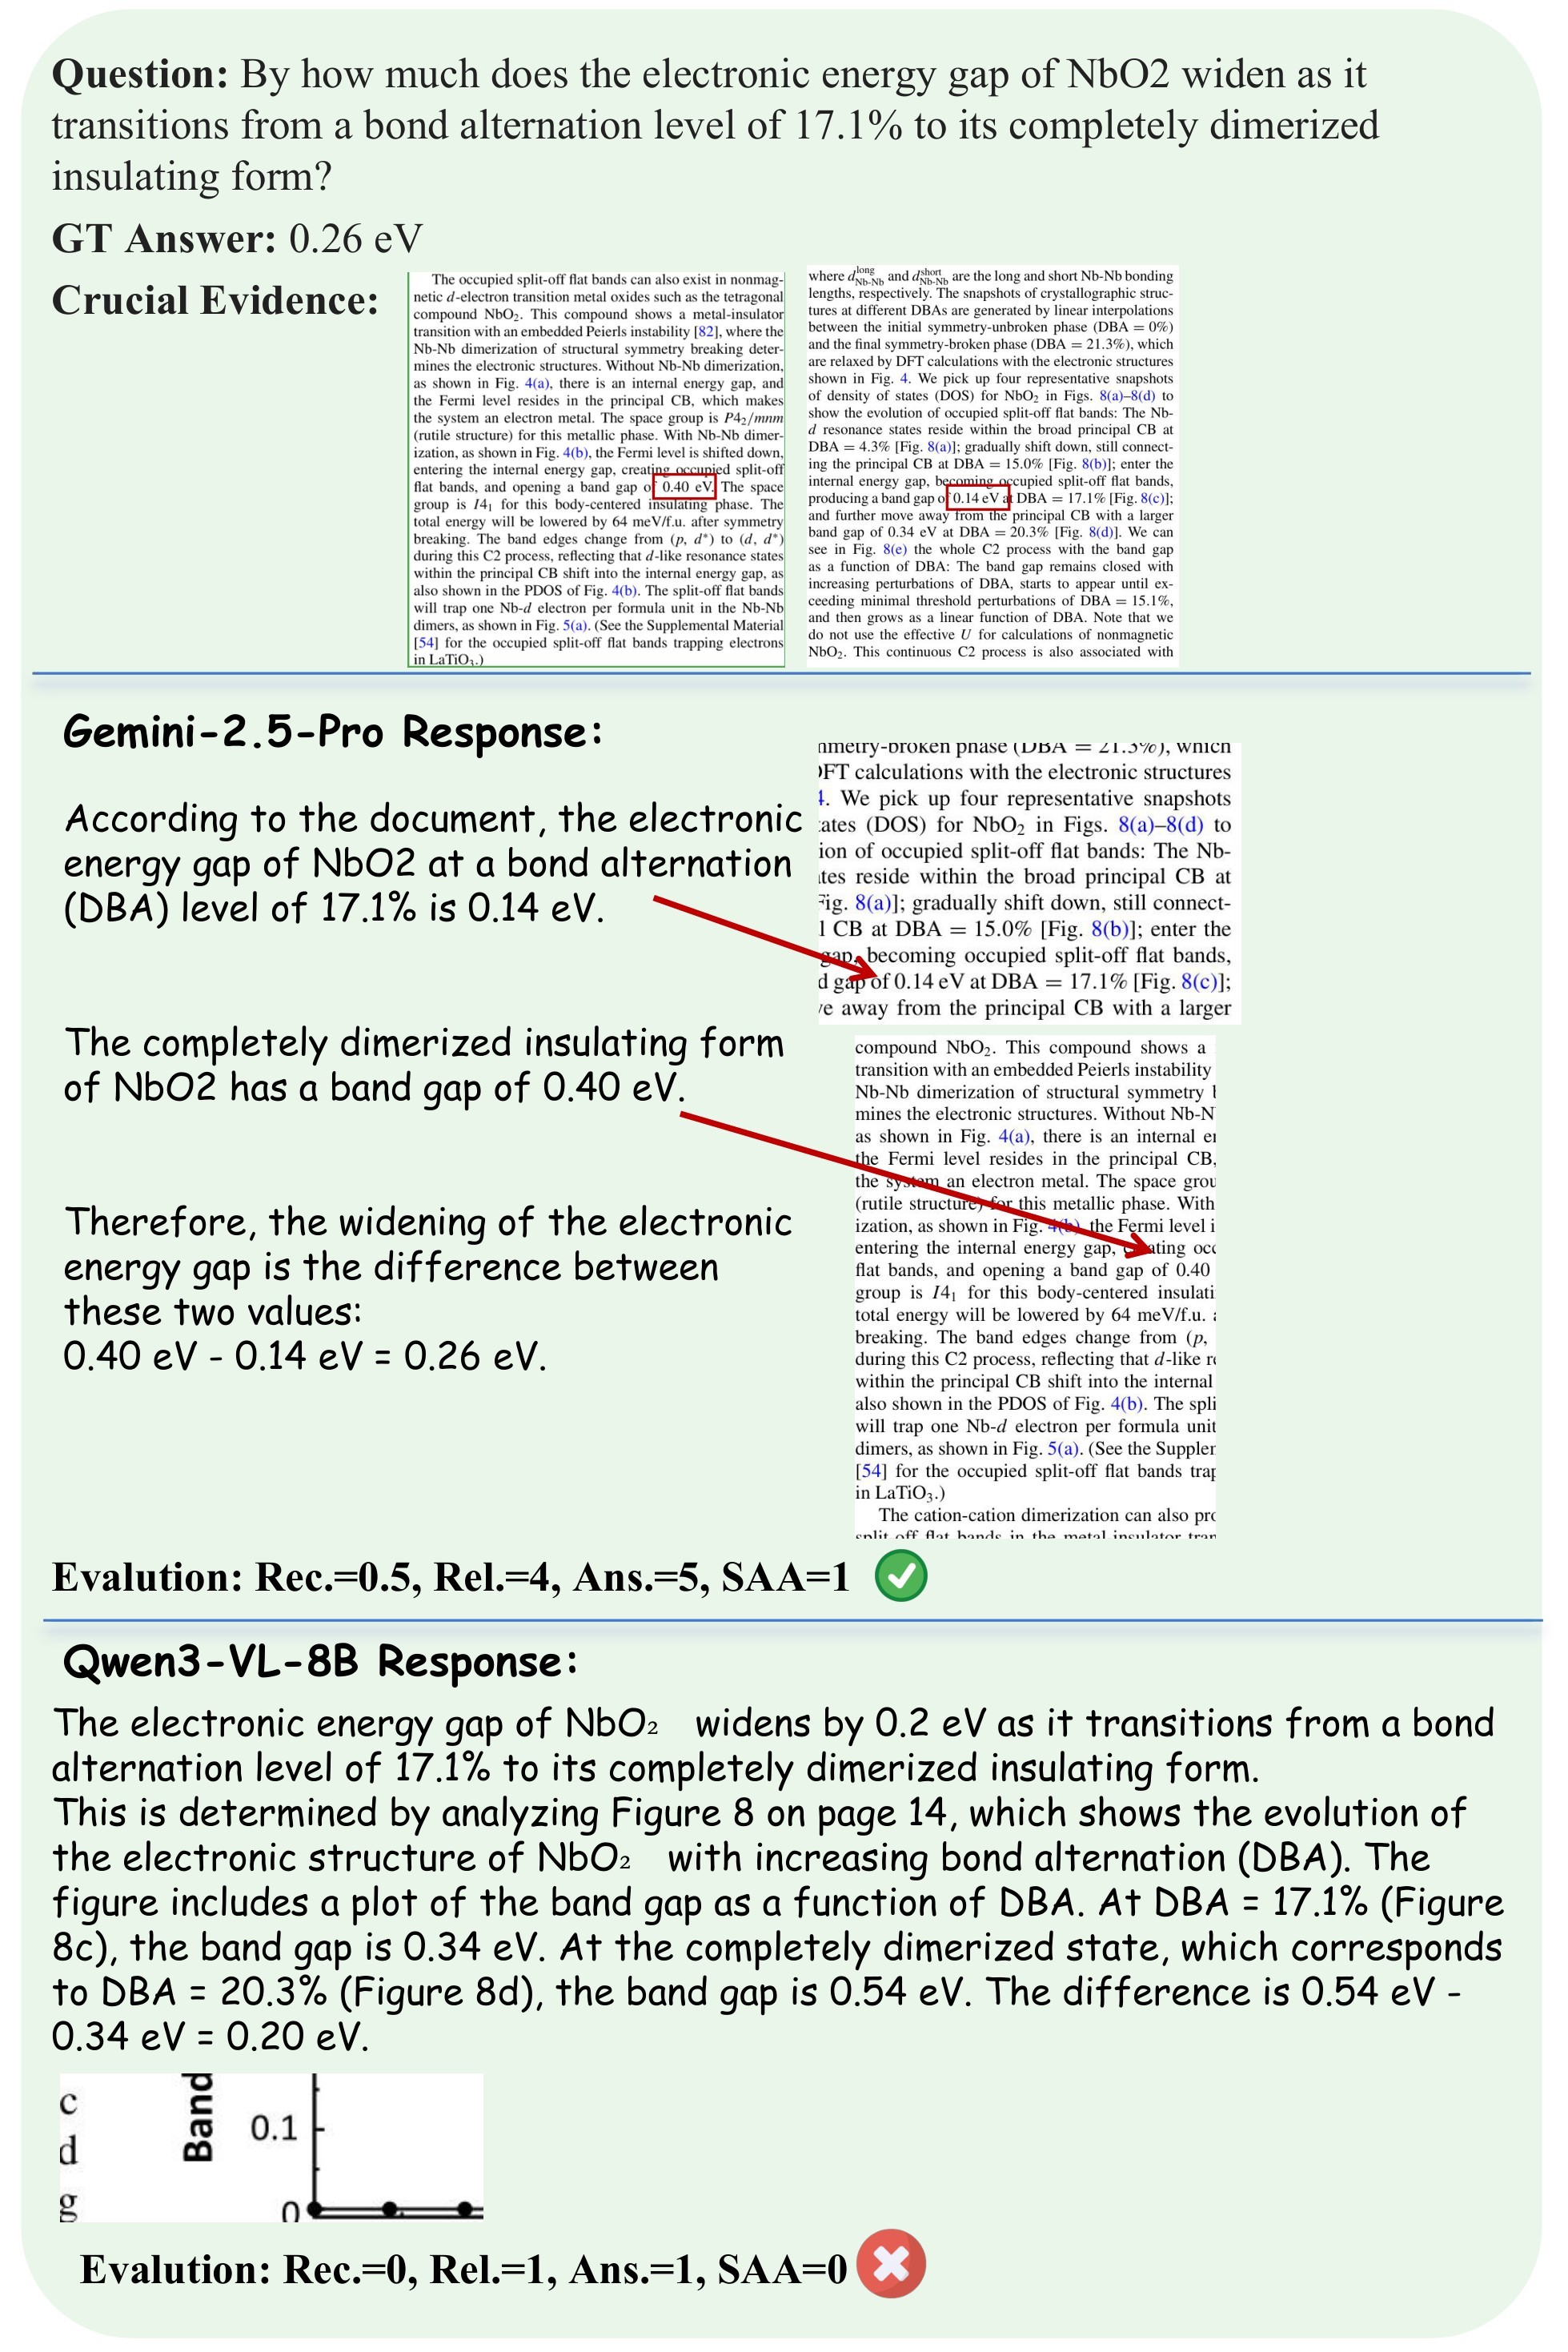
The appendix includes two larger case studies. Figure 7 shows a model with the correct text answer but wrong pricing-table citation; Figure 8 shows both semantic and visual failure in a multi-step numerical question.
Practical Takeaways
- For model evaluation, CiteVQA is most useful when the deployment needs auditable document answers, not just final-answer text. The benchmark directly checks whether cited visual evidence supports the output.
- For model builders, the main gap is localization. The strongest answerer in the table is not the strongest attributed answerer, and open-source models show especially low evidence recall.
- For retrieval and agentic document systems, page navigation is a first-class problem. The paper's supplementary analysis shows that models often fail to identify the right page before bounding-box precision becomes relevant.
- For dataset users, the automated pipeline is strong but not free of assumptions. It depends on high-end MLLMs, MinerU parsing quality, automated judges, and ablation-based definitions of crucial evidence.
- For deployment, image resolution matters. Reducing the pixel budget sharply reduces Rec. and SAA, so evidence attribution should be tested under the exact rendering and token-budget constraints of the production system.
- For follow-up research, the most actionable direction is training and evaluating models that emit evidence as a structured part of reasoning, not as a cosmetic citation after generating an answer.
The paper's stated limitations are important: domain-specific definitions of authoritative evidence may vary, large-scale replication requires substantial compute, and coordinate-level evaluation is more expensive than standard VQA scoring. There is also a risk that models overfit to CiteVQA's document distributions and metrics instead of learning general evidence attribution.
Reference Coverage
- Additional local references for validation and navigation: fig-ability-radar, fig-domain-radar.