Source-first digest for monthly 2026_05 rank 21, rank_id p014.
- PDF extraction: not used
Motivation / Background
Perception or Prejudice asks whether multimodal large language models can justify personality judgments with observable behavioral evidence, rather than merely matching the surface patterns that correlate with Big Five labels. The paper argues that rating-only apparent personality recognition is too weak for high-stakes human-facing use: a model can predict the right ordinal trait score while failing to retrieve the gaze, posture, voice, expression, or temporal cue that would make the judgment trustworthy.
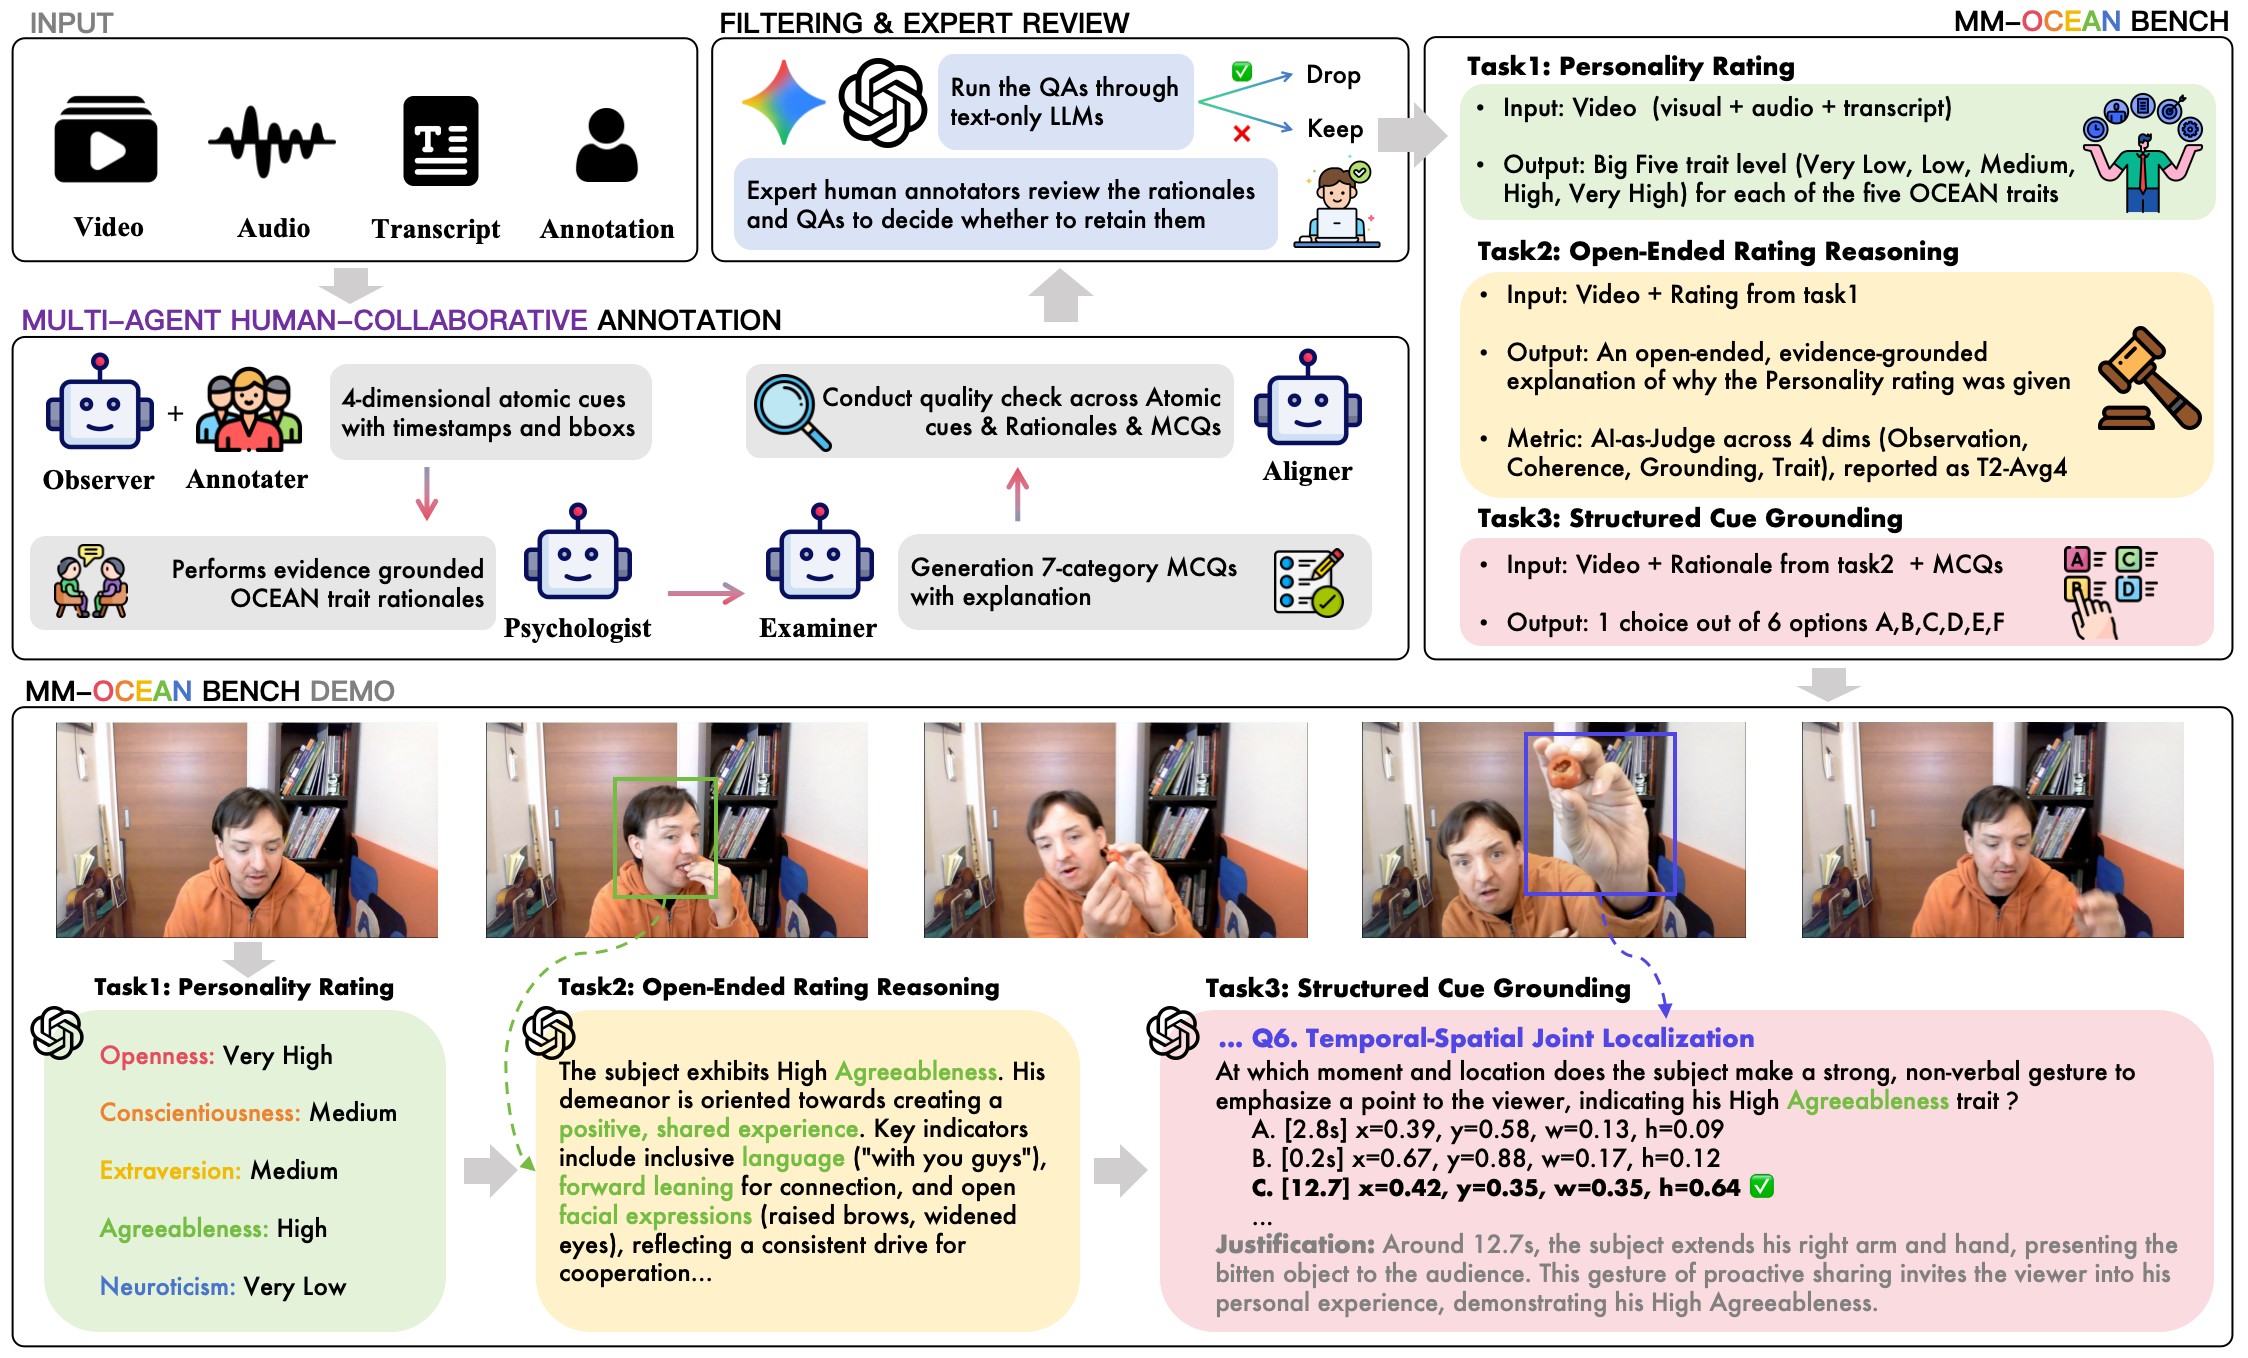
The paper's core benchmark contribution is Grounded Personality Reasoning (GPR). GPR turns personality perception into a three-part chain: predict the Big Five rating, explain the rating through evidence-grounded reasoning, and answer structured cue-grounding questions that force localization of the supporting behavior. The paper then builds MM-OCEAN, a video benchmark with human-verified atomic observations, evidence-grounded trait analyses, and targeted MCQs. The main claim set and source support levels are summarized in Table 1.
Claims And Evidence
Support scores in Table 1 are internal source-support scores, not independent reproduction scores. A score of 5 means the claim is directly backed by source definitions, source-reported data, equations, figures, or appendix checks. A score of 4 means the paper gives clear evidence but the conclusion depends on benchmark design, judge reliability, or non-causal observational grouping.
| Claim id | Main claim | Support | Evidence anchors |
|---|---|---|---|
| C1 | Rating-only personality benchmarks can over-credit models that produce the right Big Five score for the wrong reason; GPR is designed to require rating, reasoning, and cue grounding together. | 5 | problem framing, task equations, failure metrics |
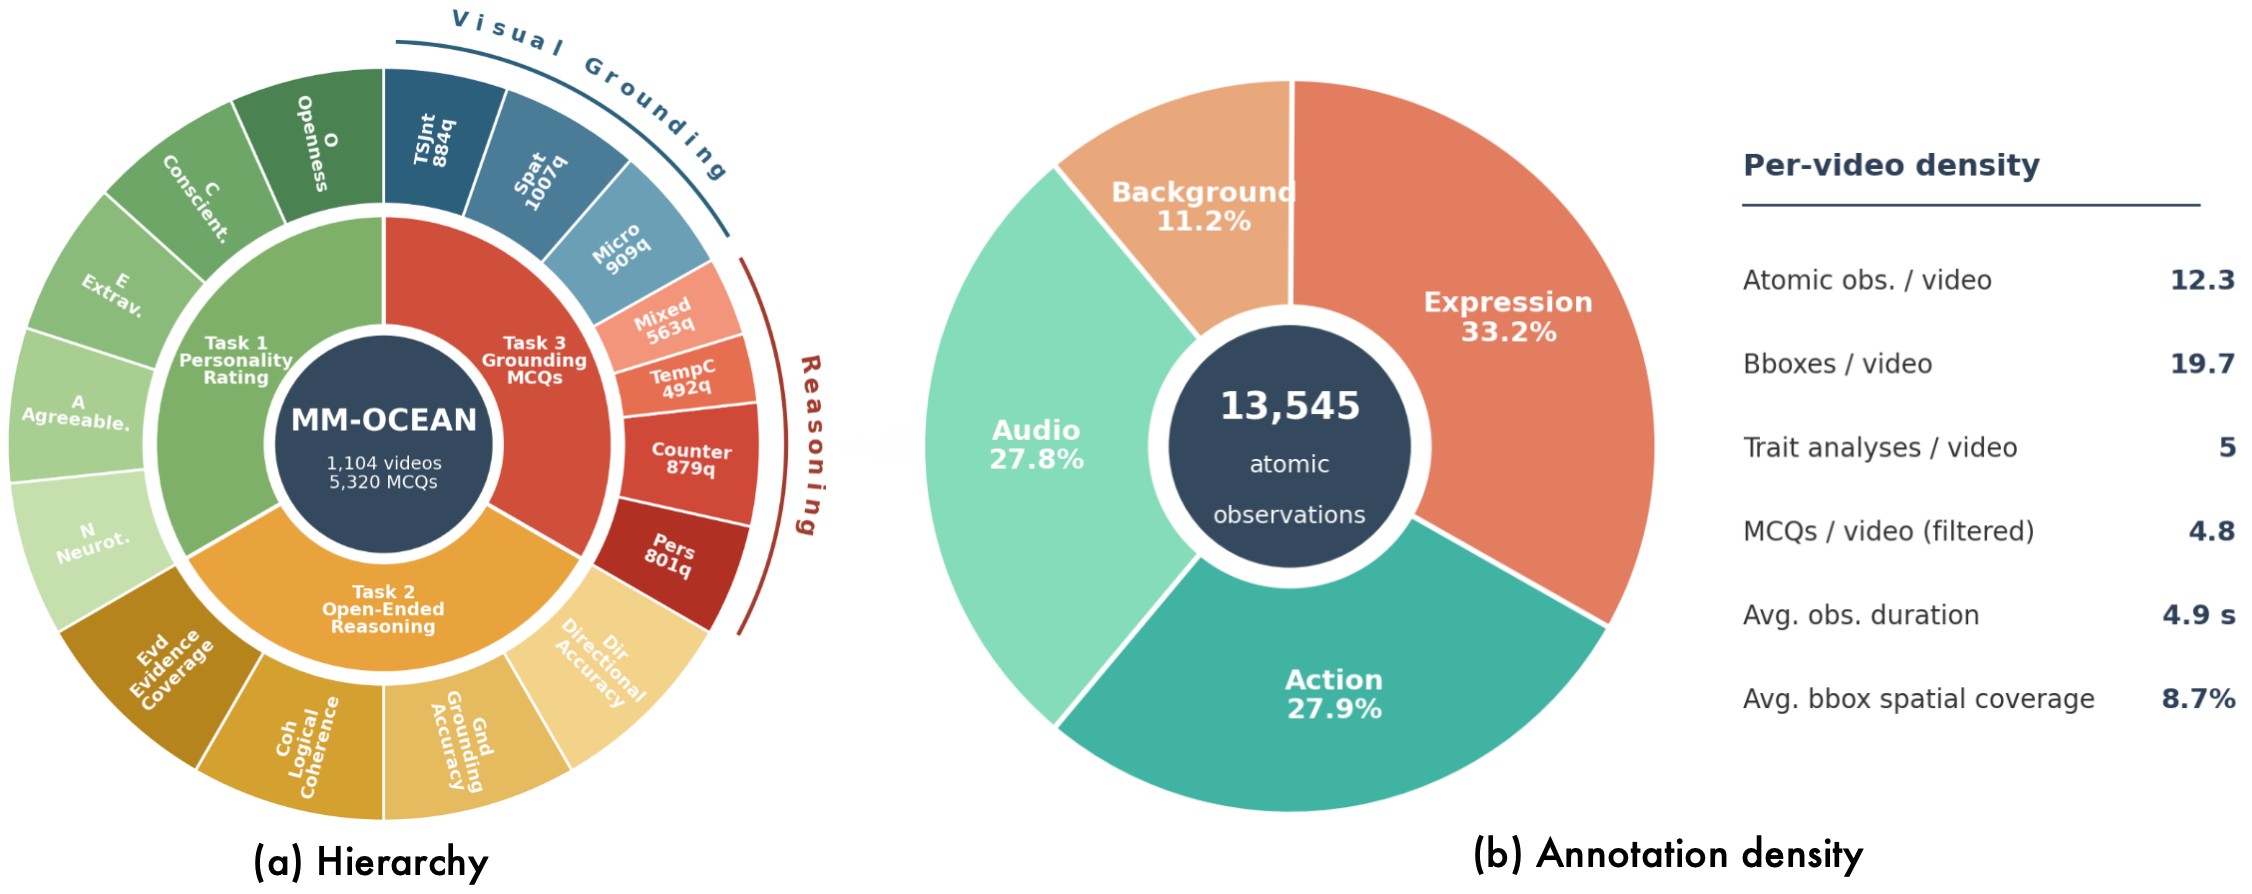
| C2 | MM-OCEAN is a source dataset for GPR: 1,104 short videos, about 13.5K human-verified observations, 5,520 trait analyses, and 5,320 retained cue-grounding MCQs. | 5 | dataset construction, dataset statistics, Figure 1, Figure 2 |
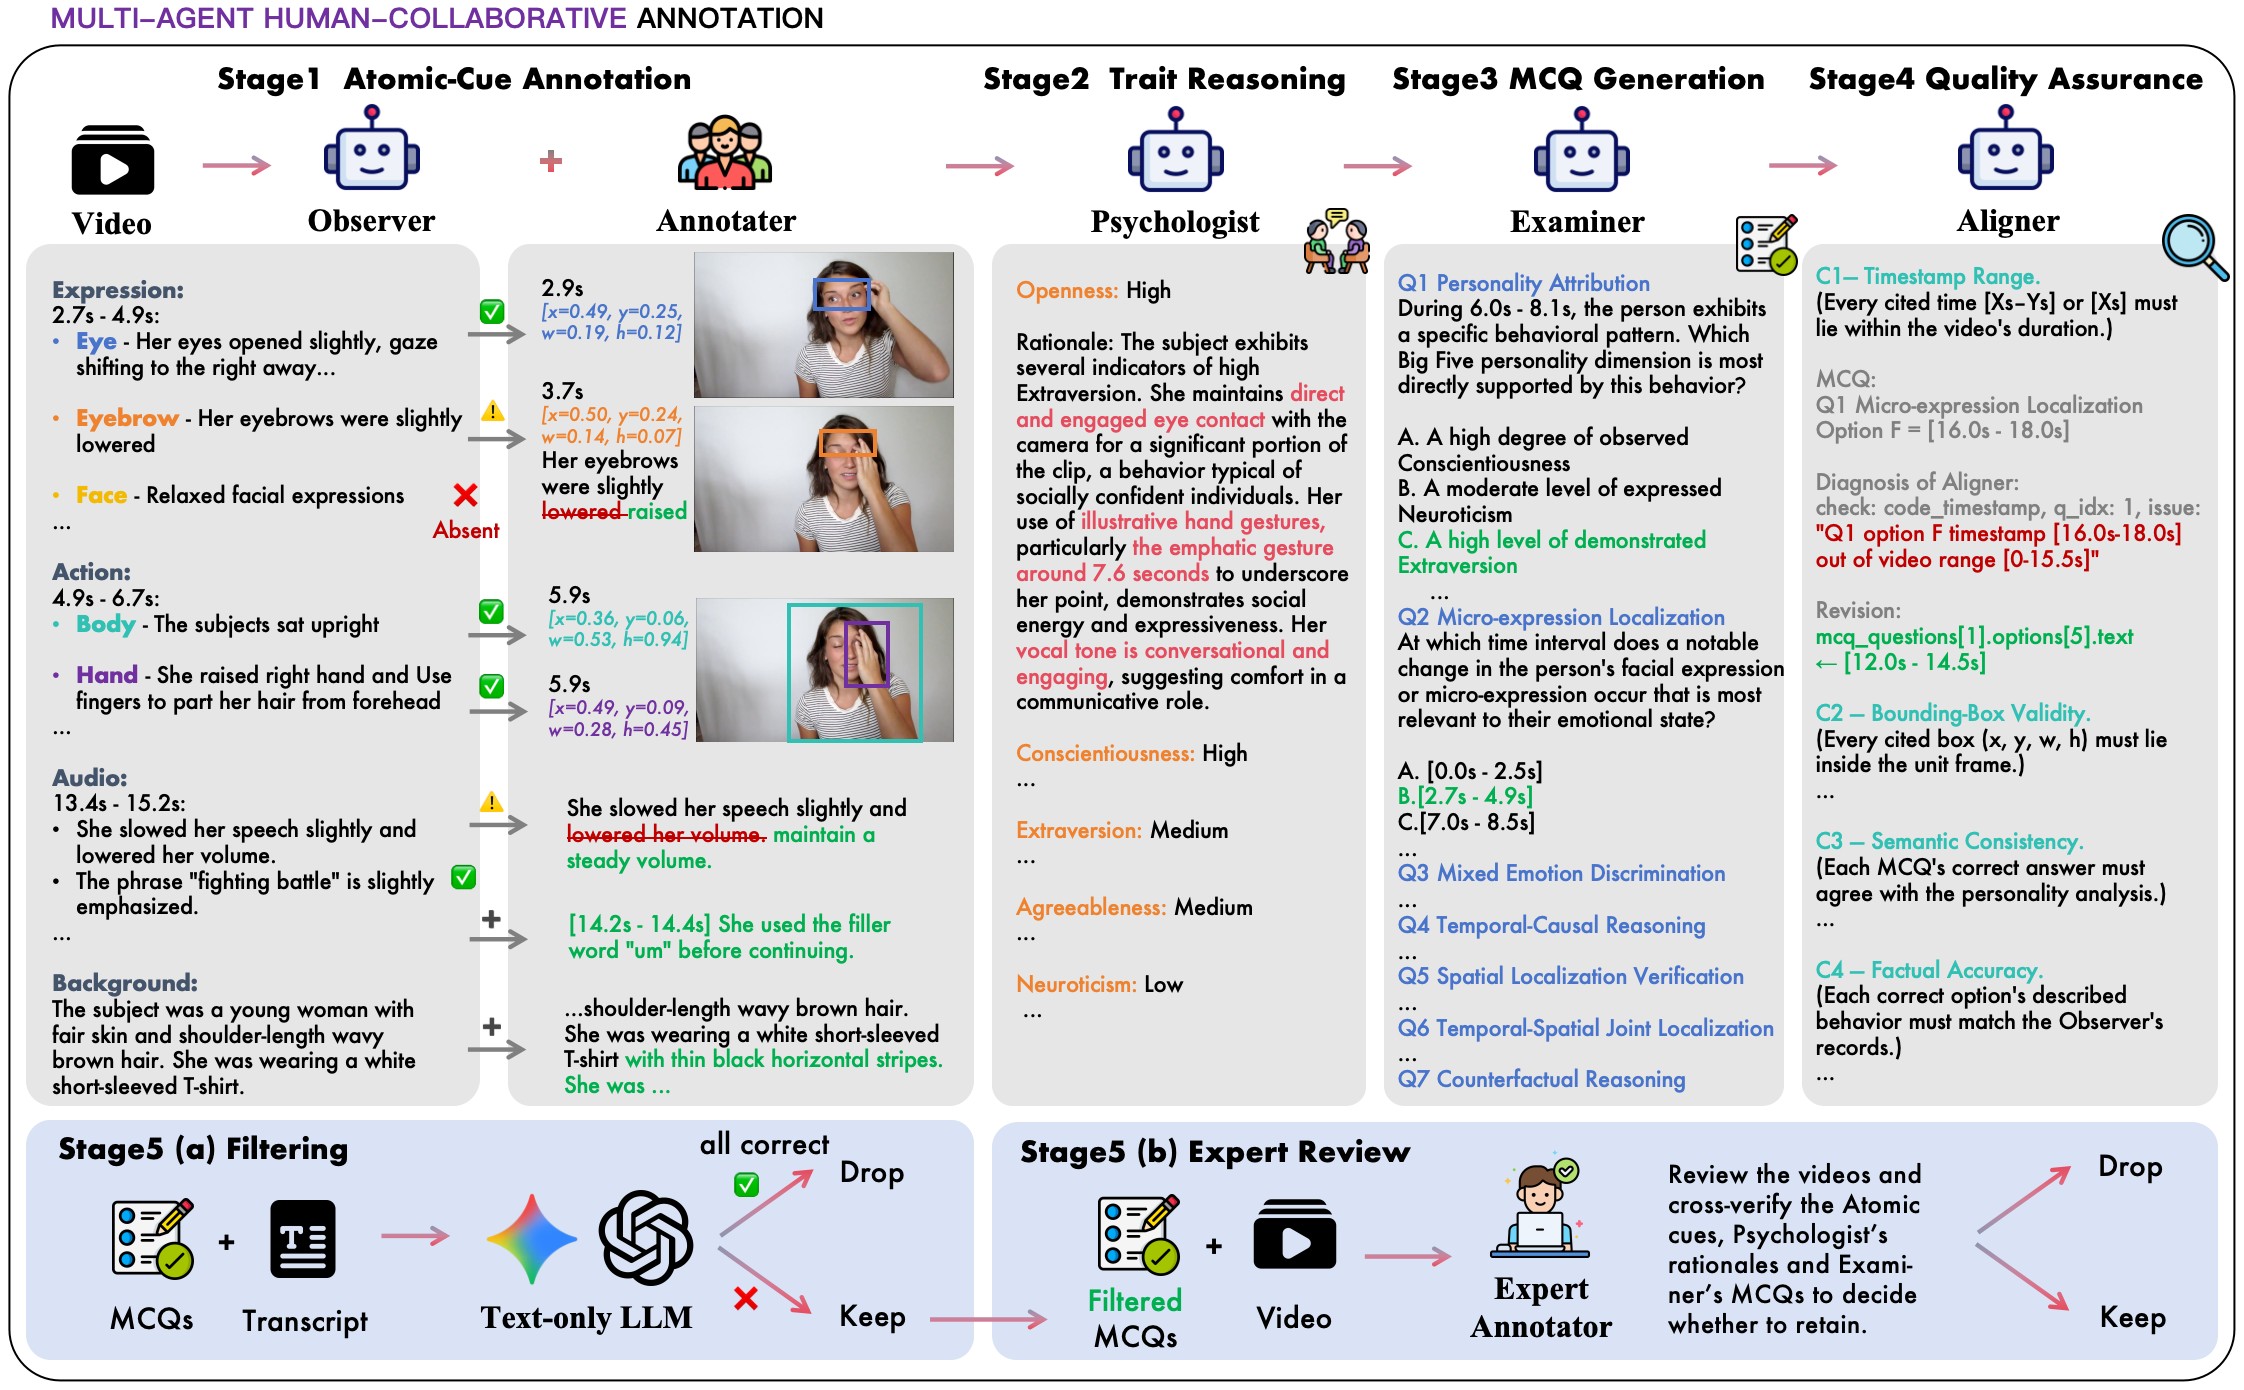
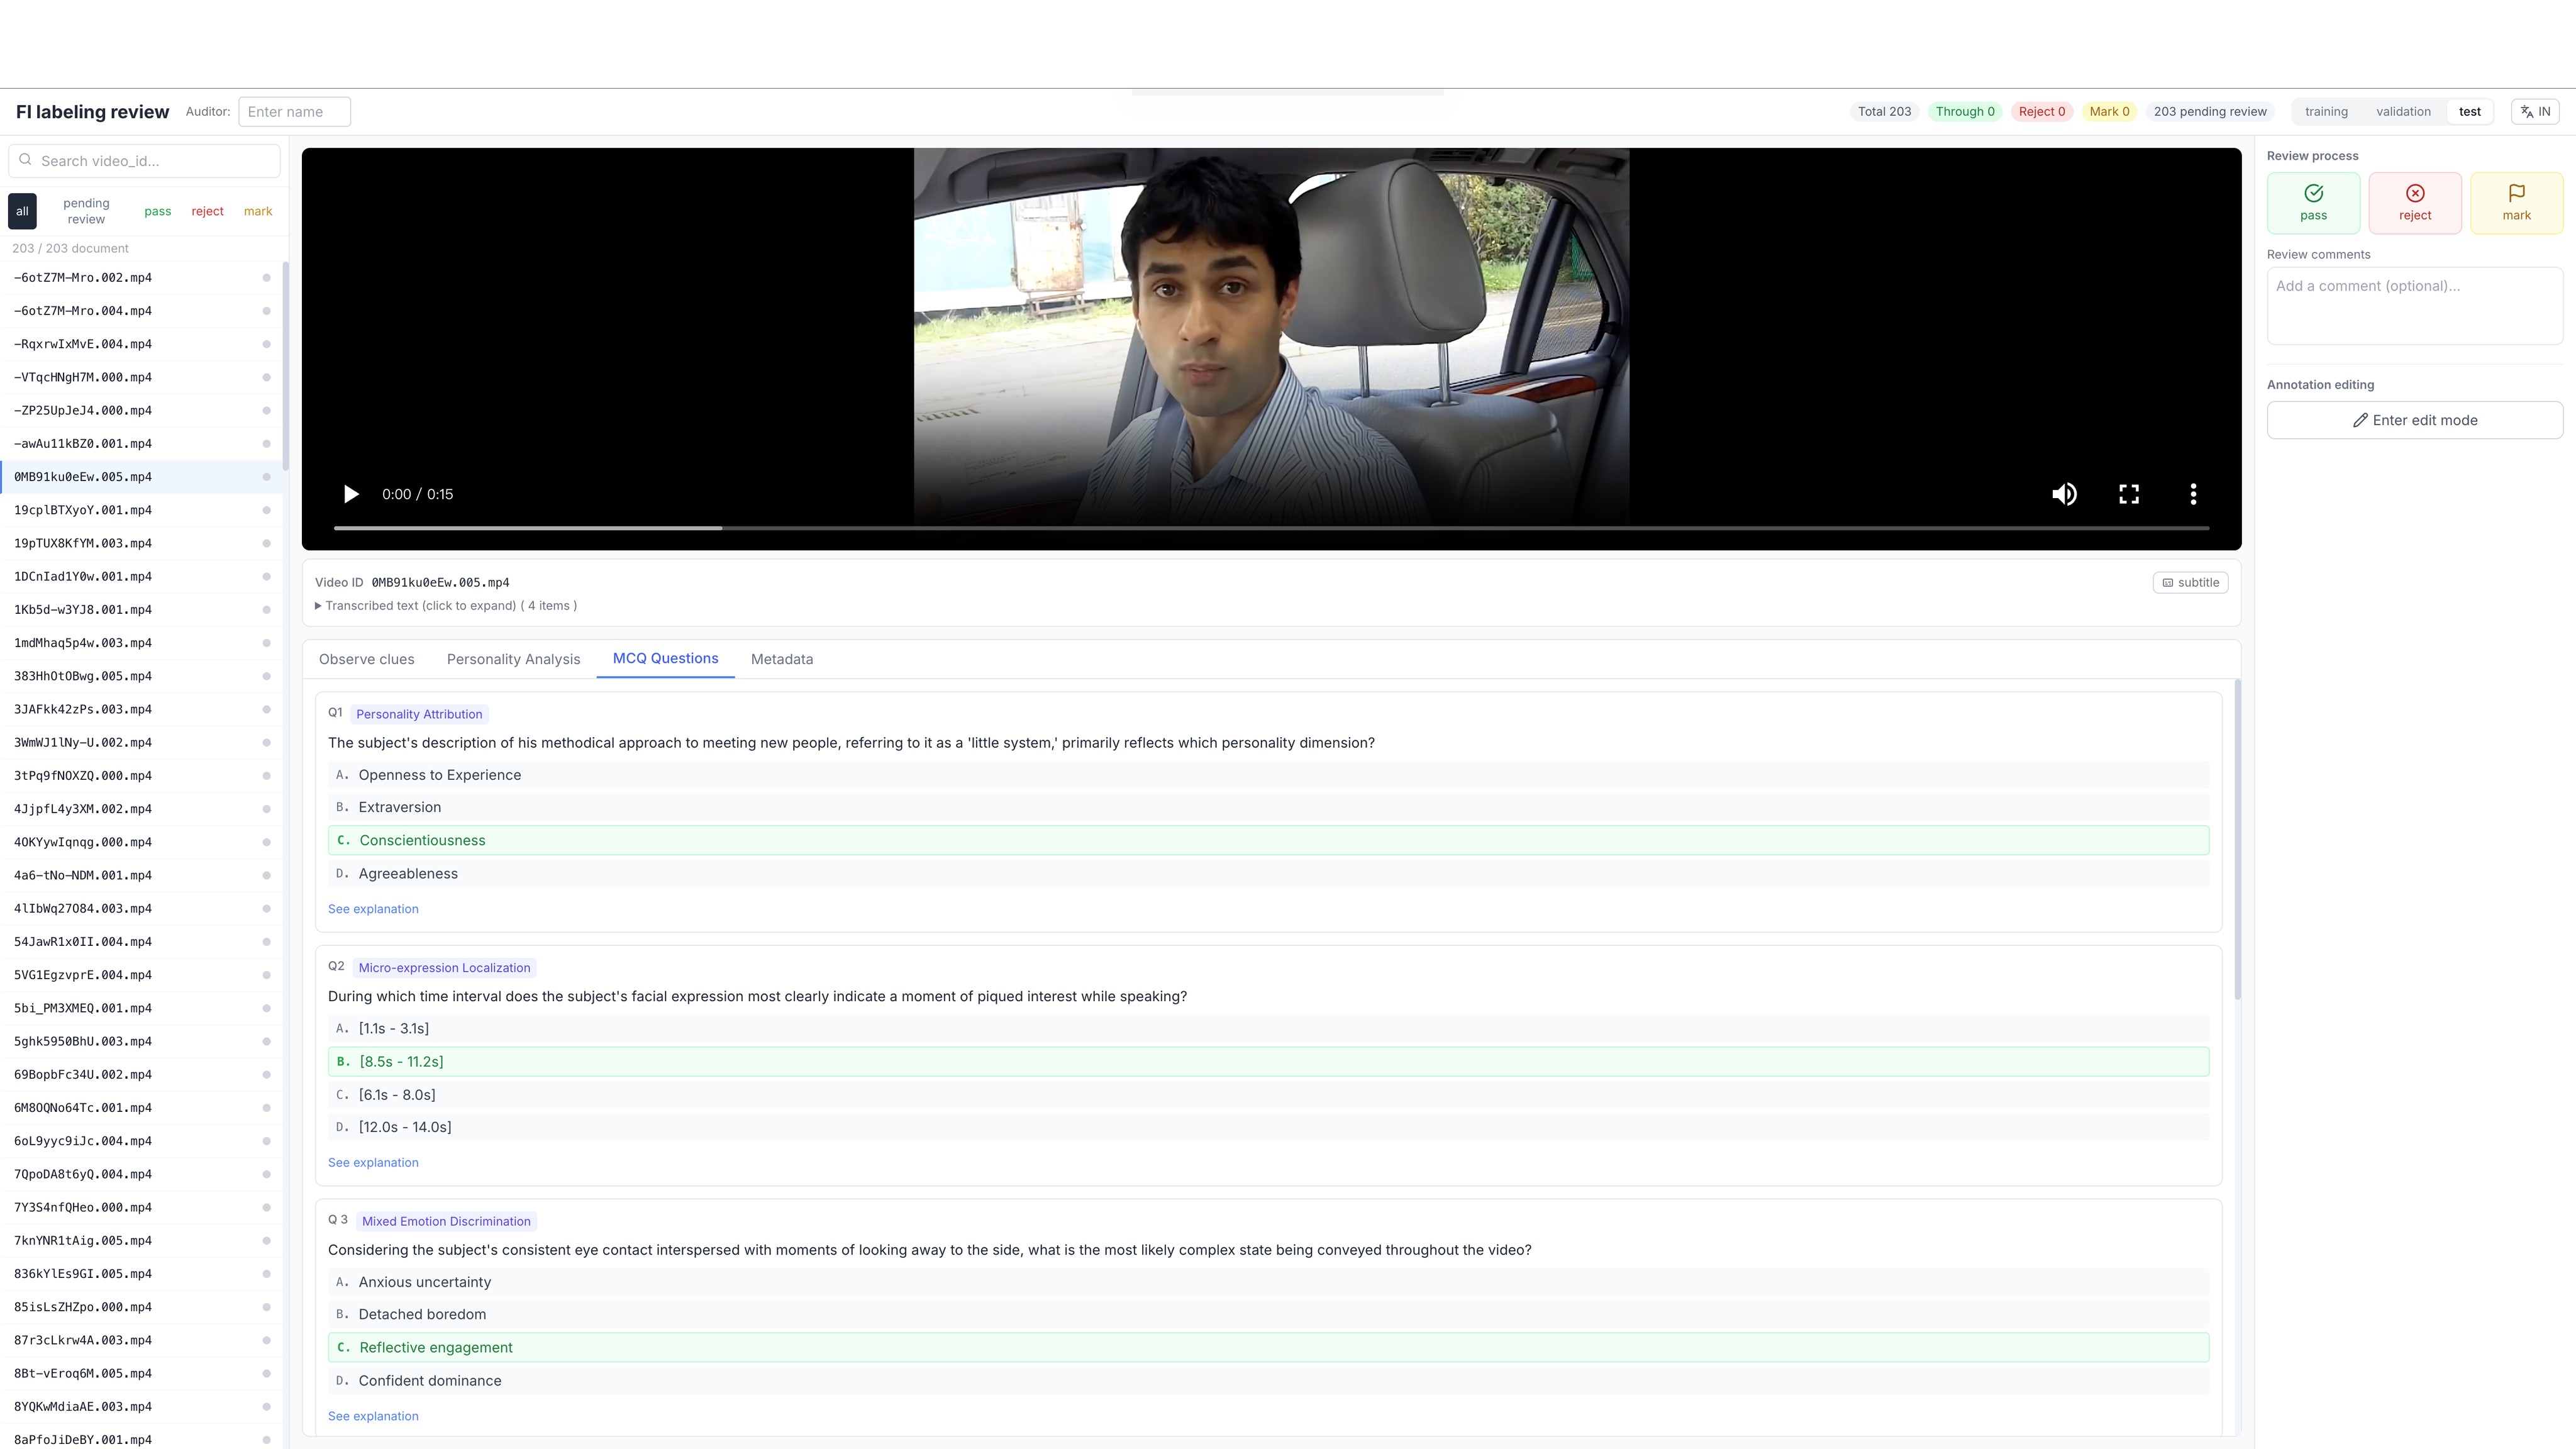
| C3 | The annotation pipeline deliberately separates observation from interpretation, then uses human verification, text-leakage filtering, and expert review to reduce shortcut questions. | 5 | pipeline stages, annotation protocol, Figure 3, Figure 6 |
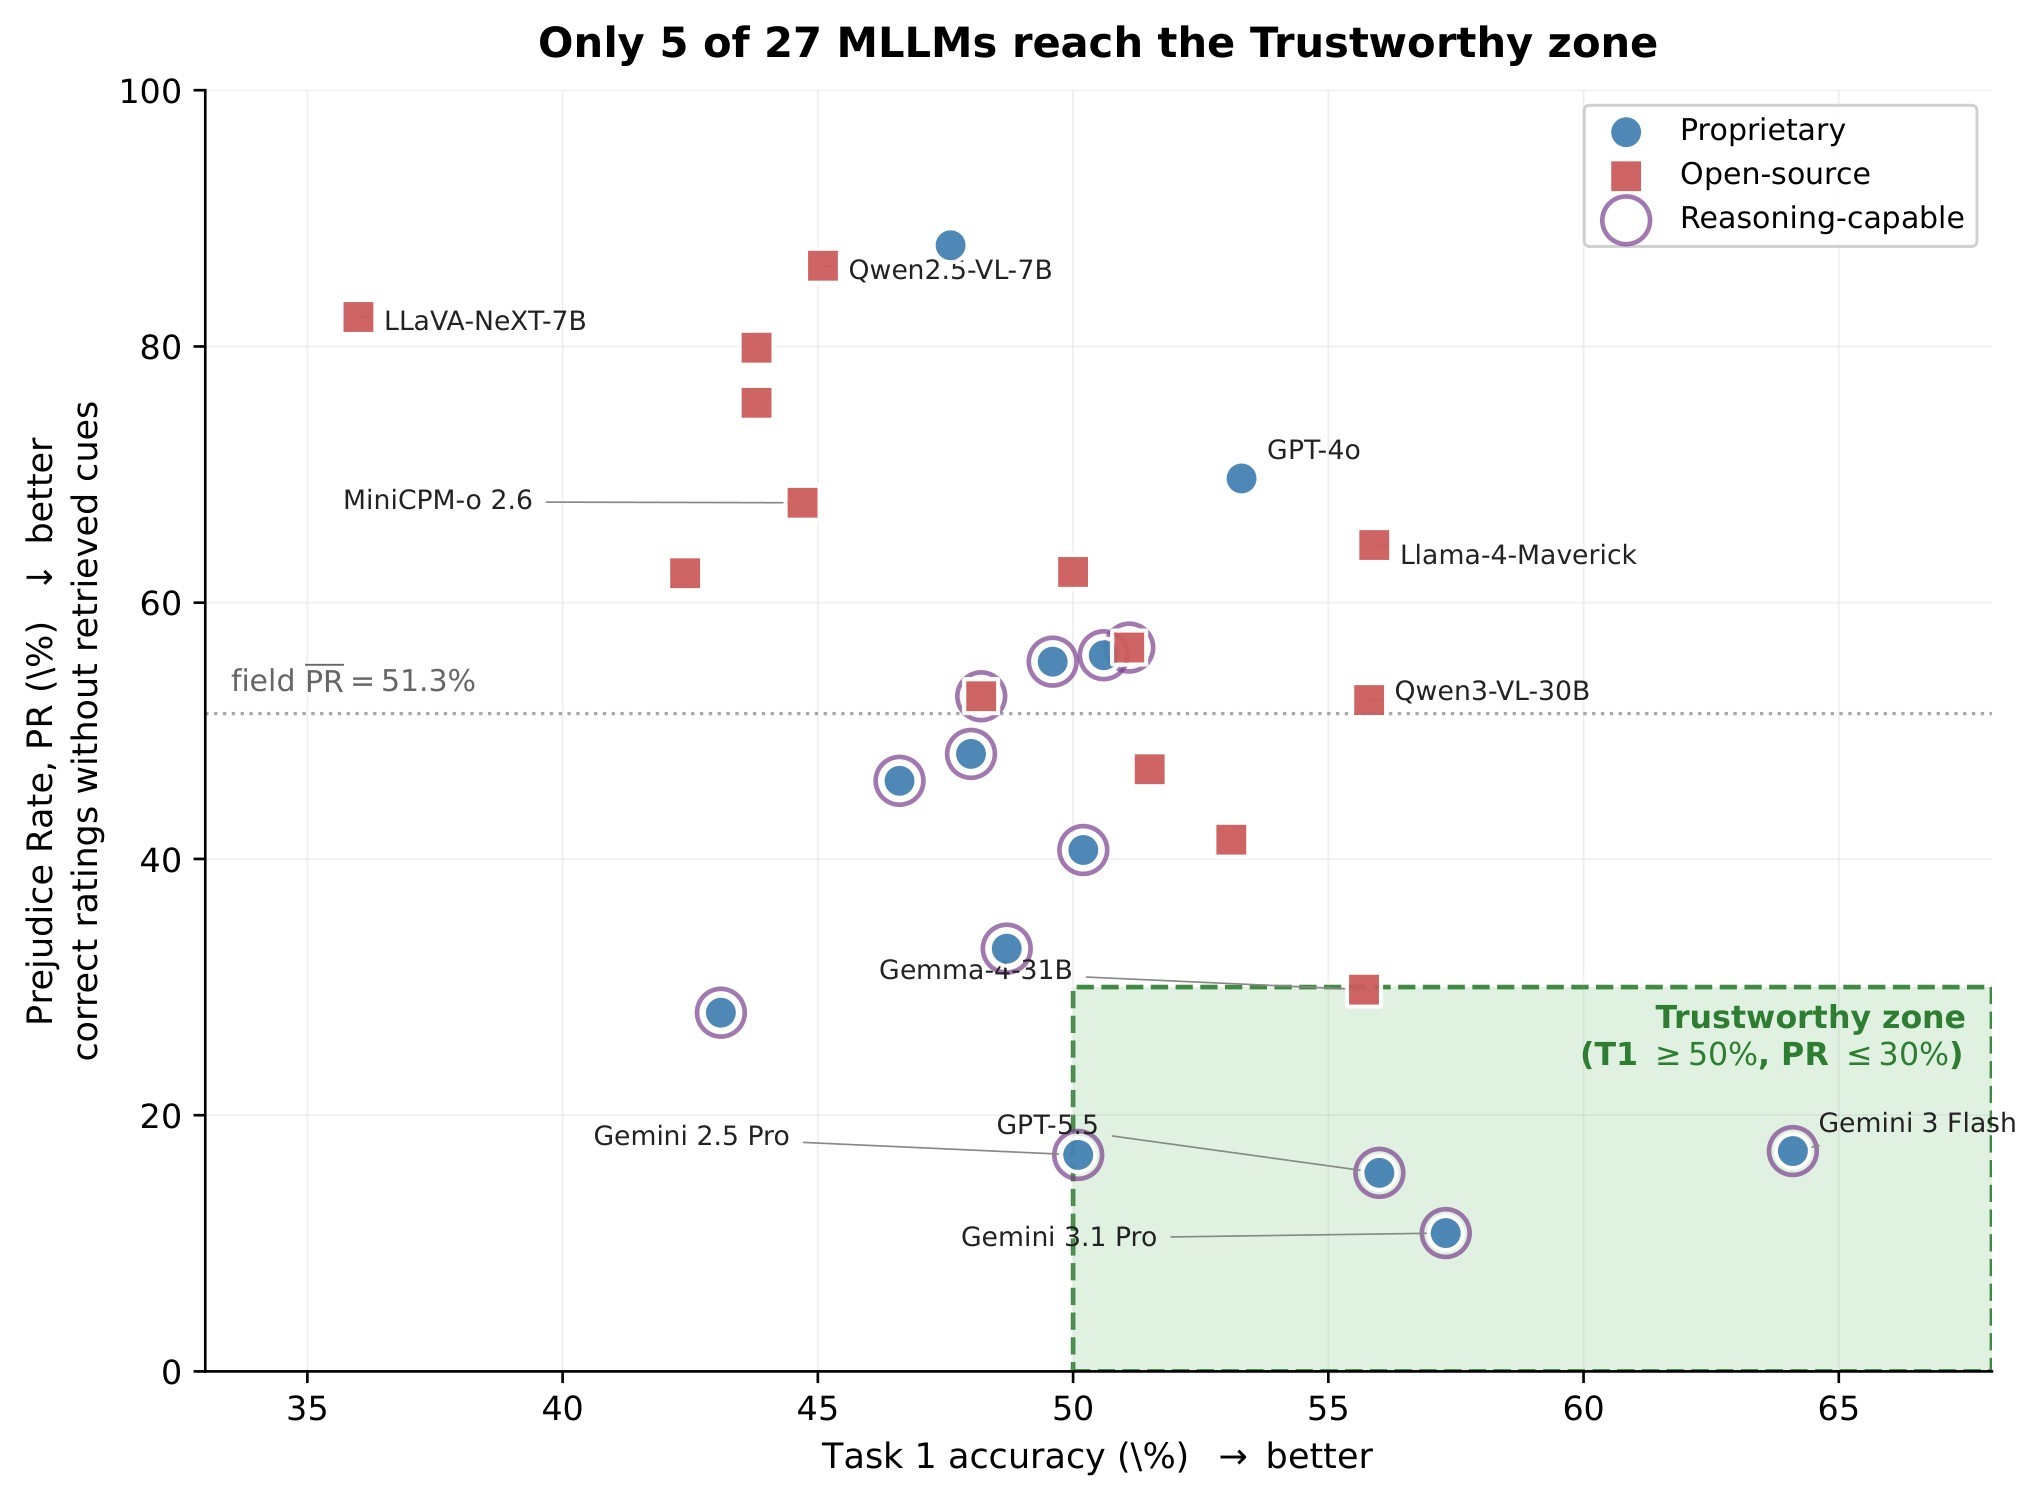
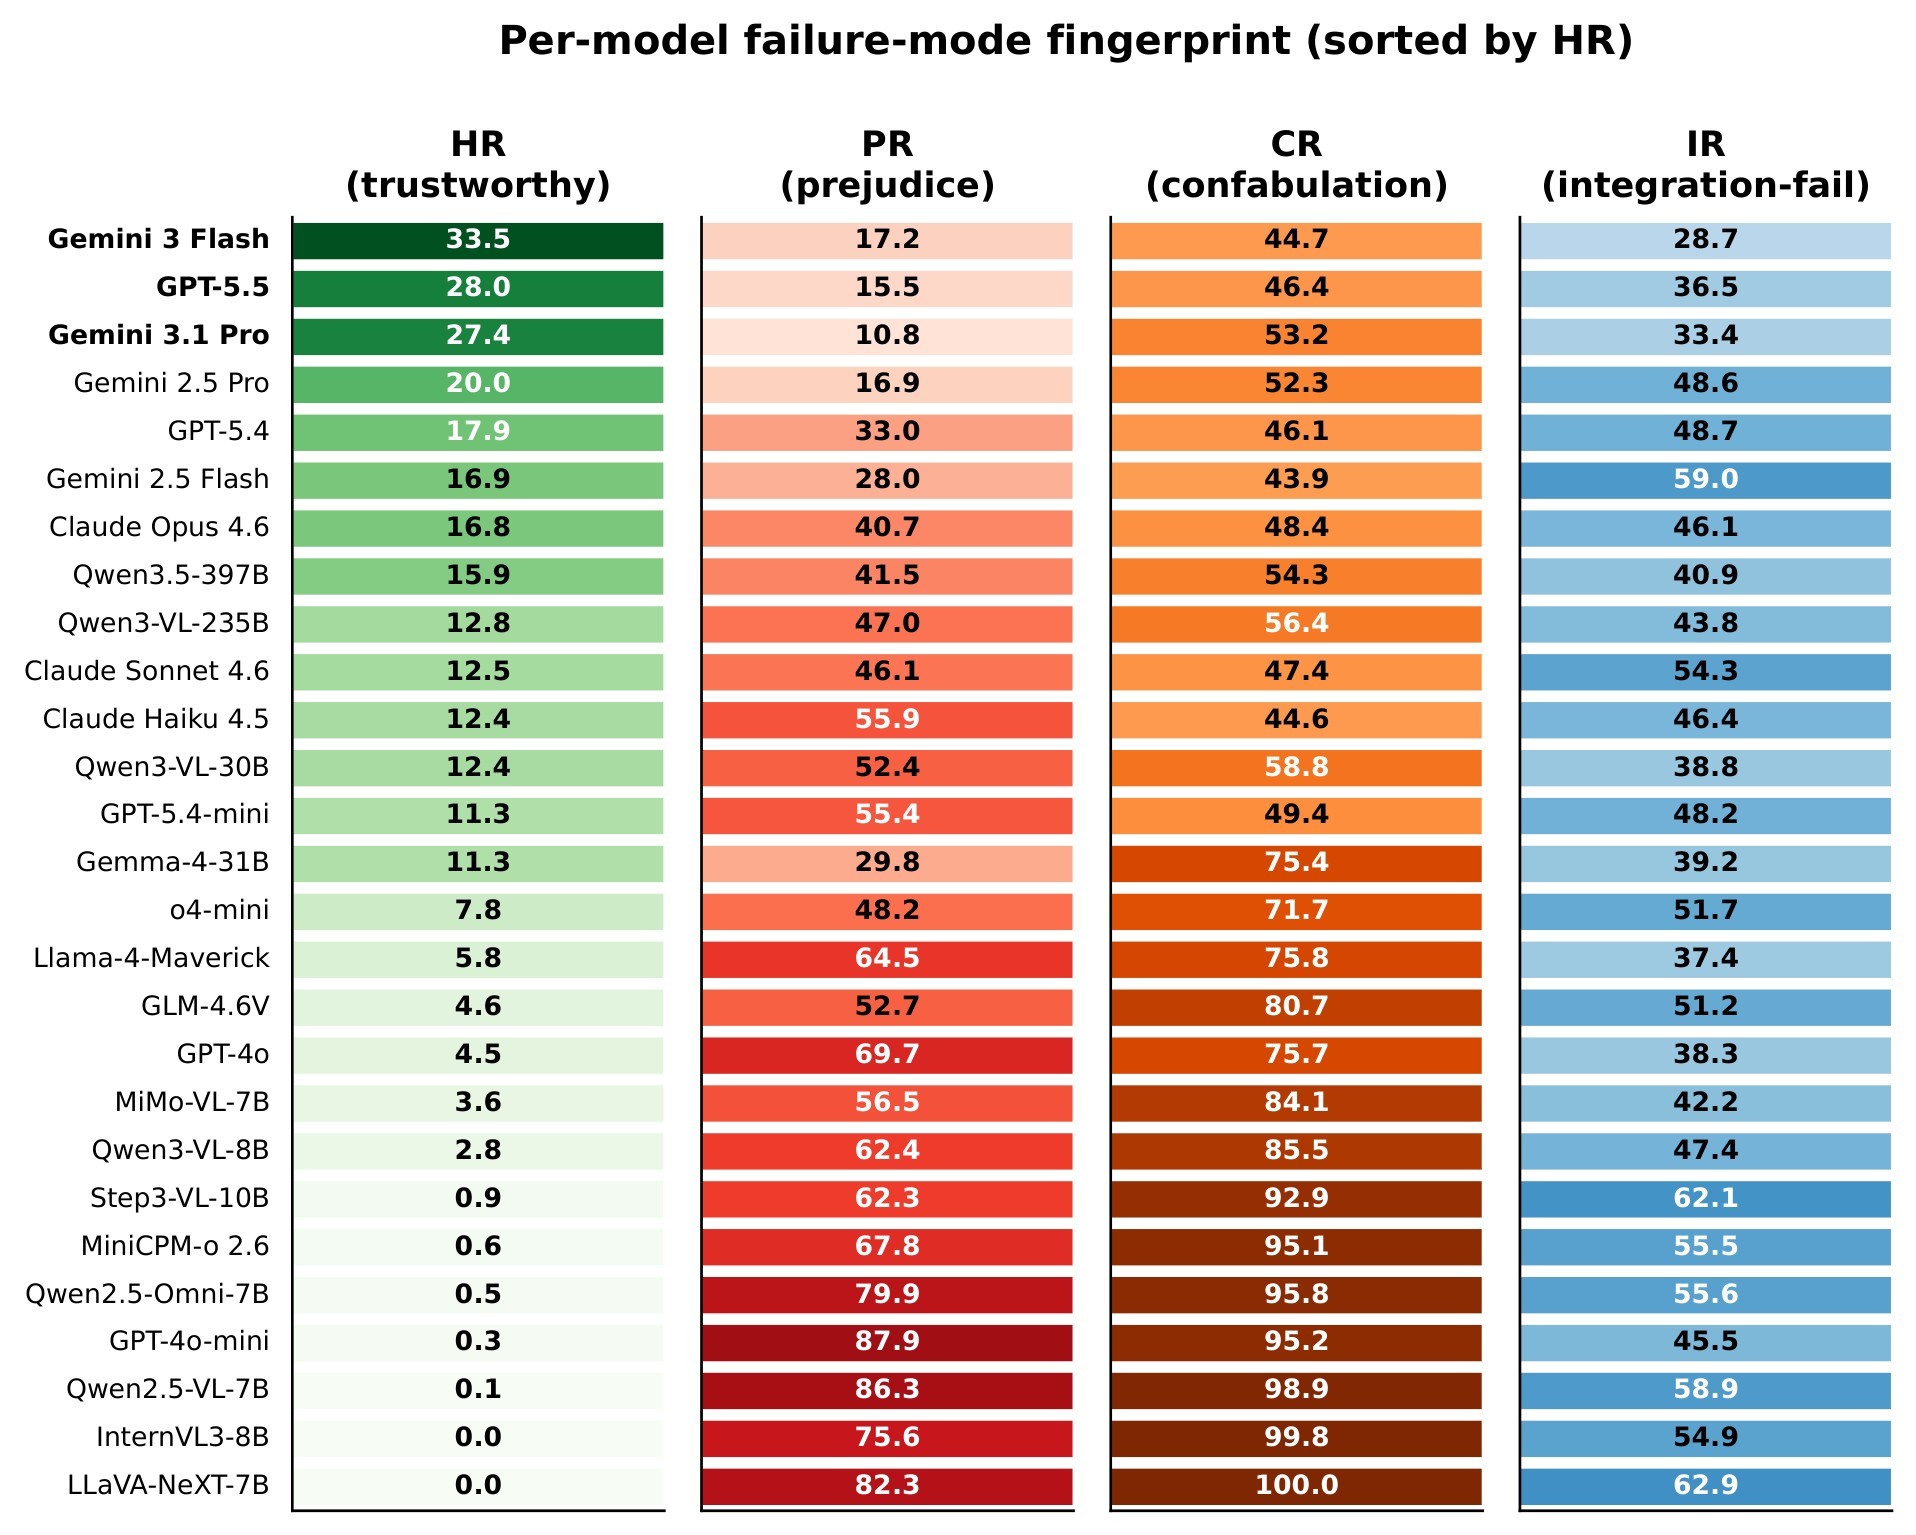
| C4 | The central empirical finding is a field-wide Prejudice Gap: mean PR is 51.3%, mean HR is 10.4%, and the best HR reaches only 33.5%. | 5 | headline results, Figure 4, Figure 11, Figure 12 |
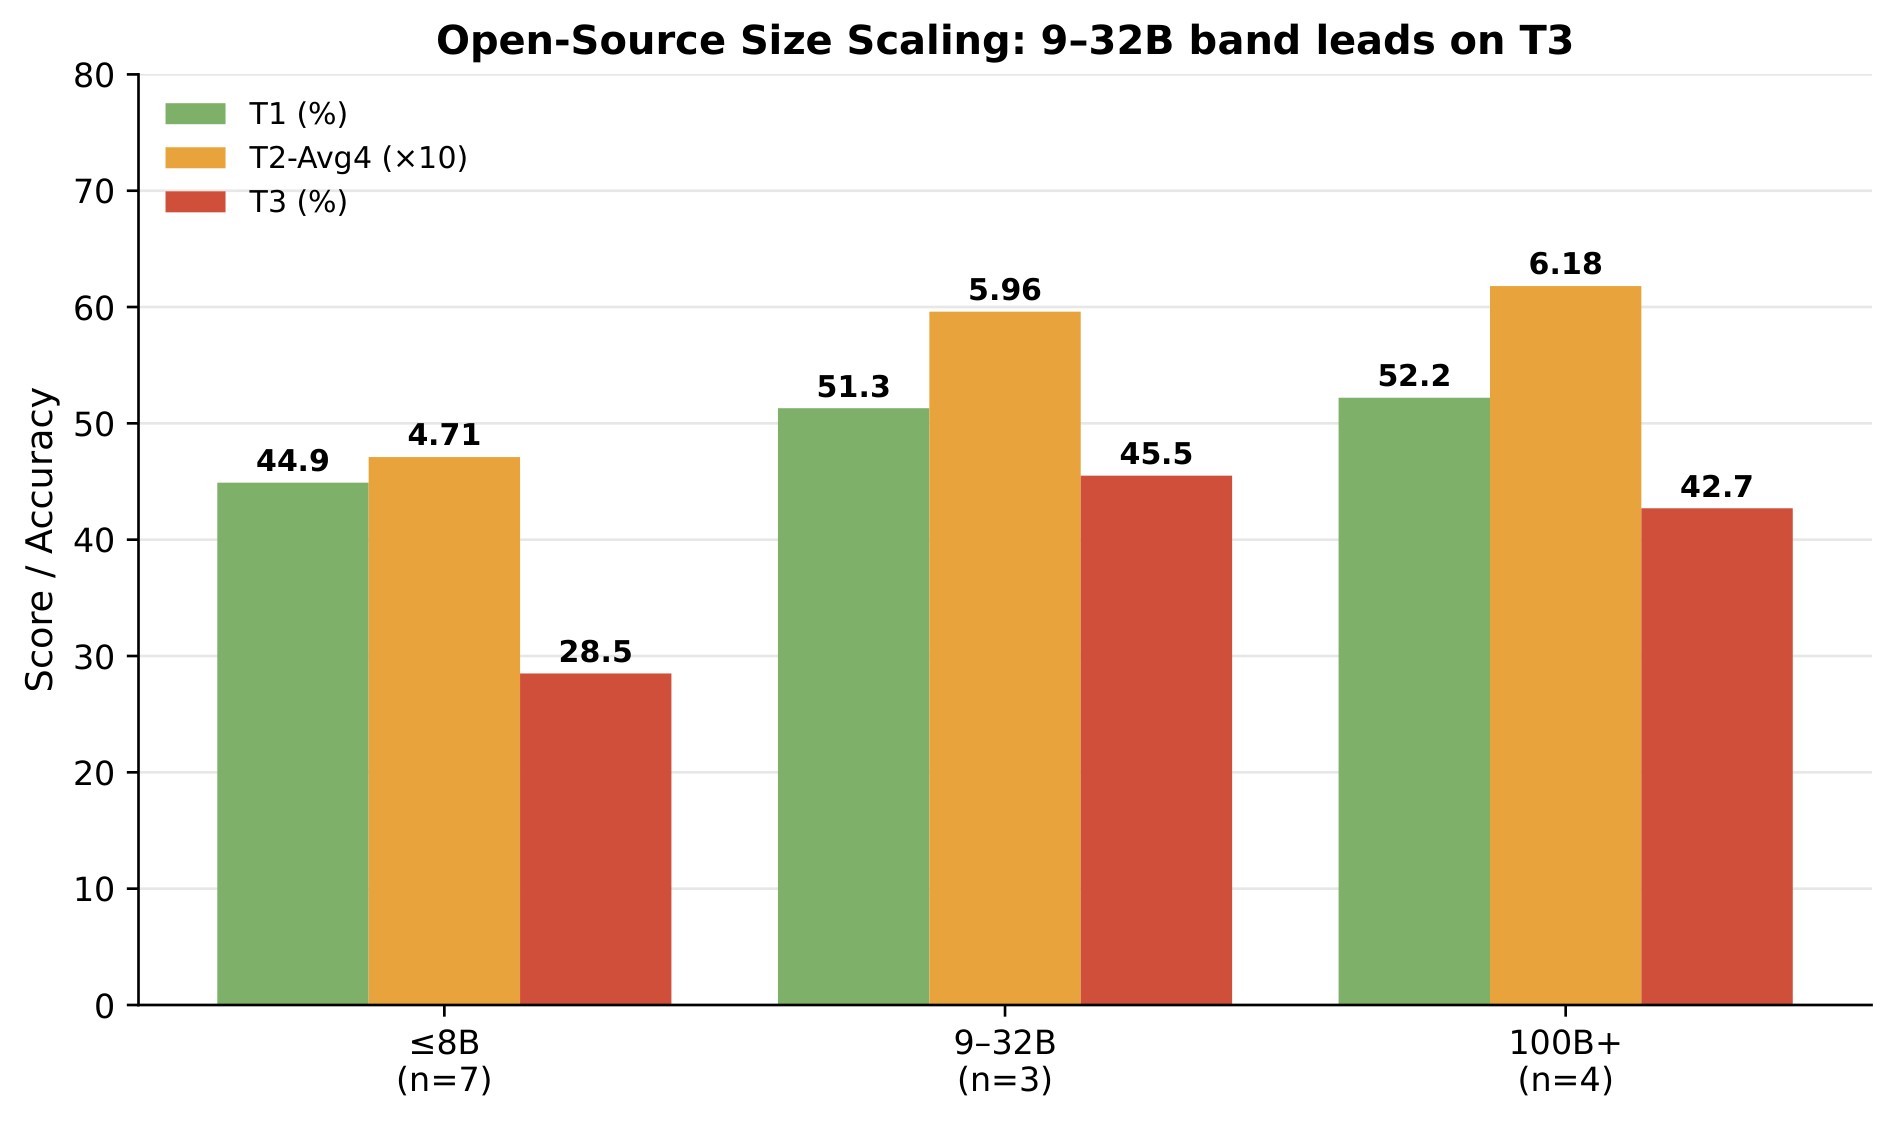
| C5 | The largest open-vs-closed gap is not rating or verbal explanation, but cue retrieval: the paper reports a -26.6 percentage point open frontier gap on T3. | 5 | category diagnostics, Table 5, Figure 4, Figure 16 |
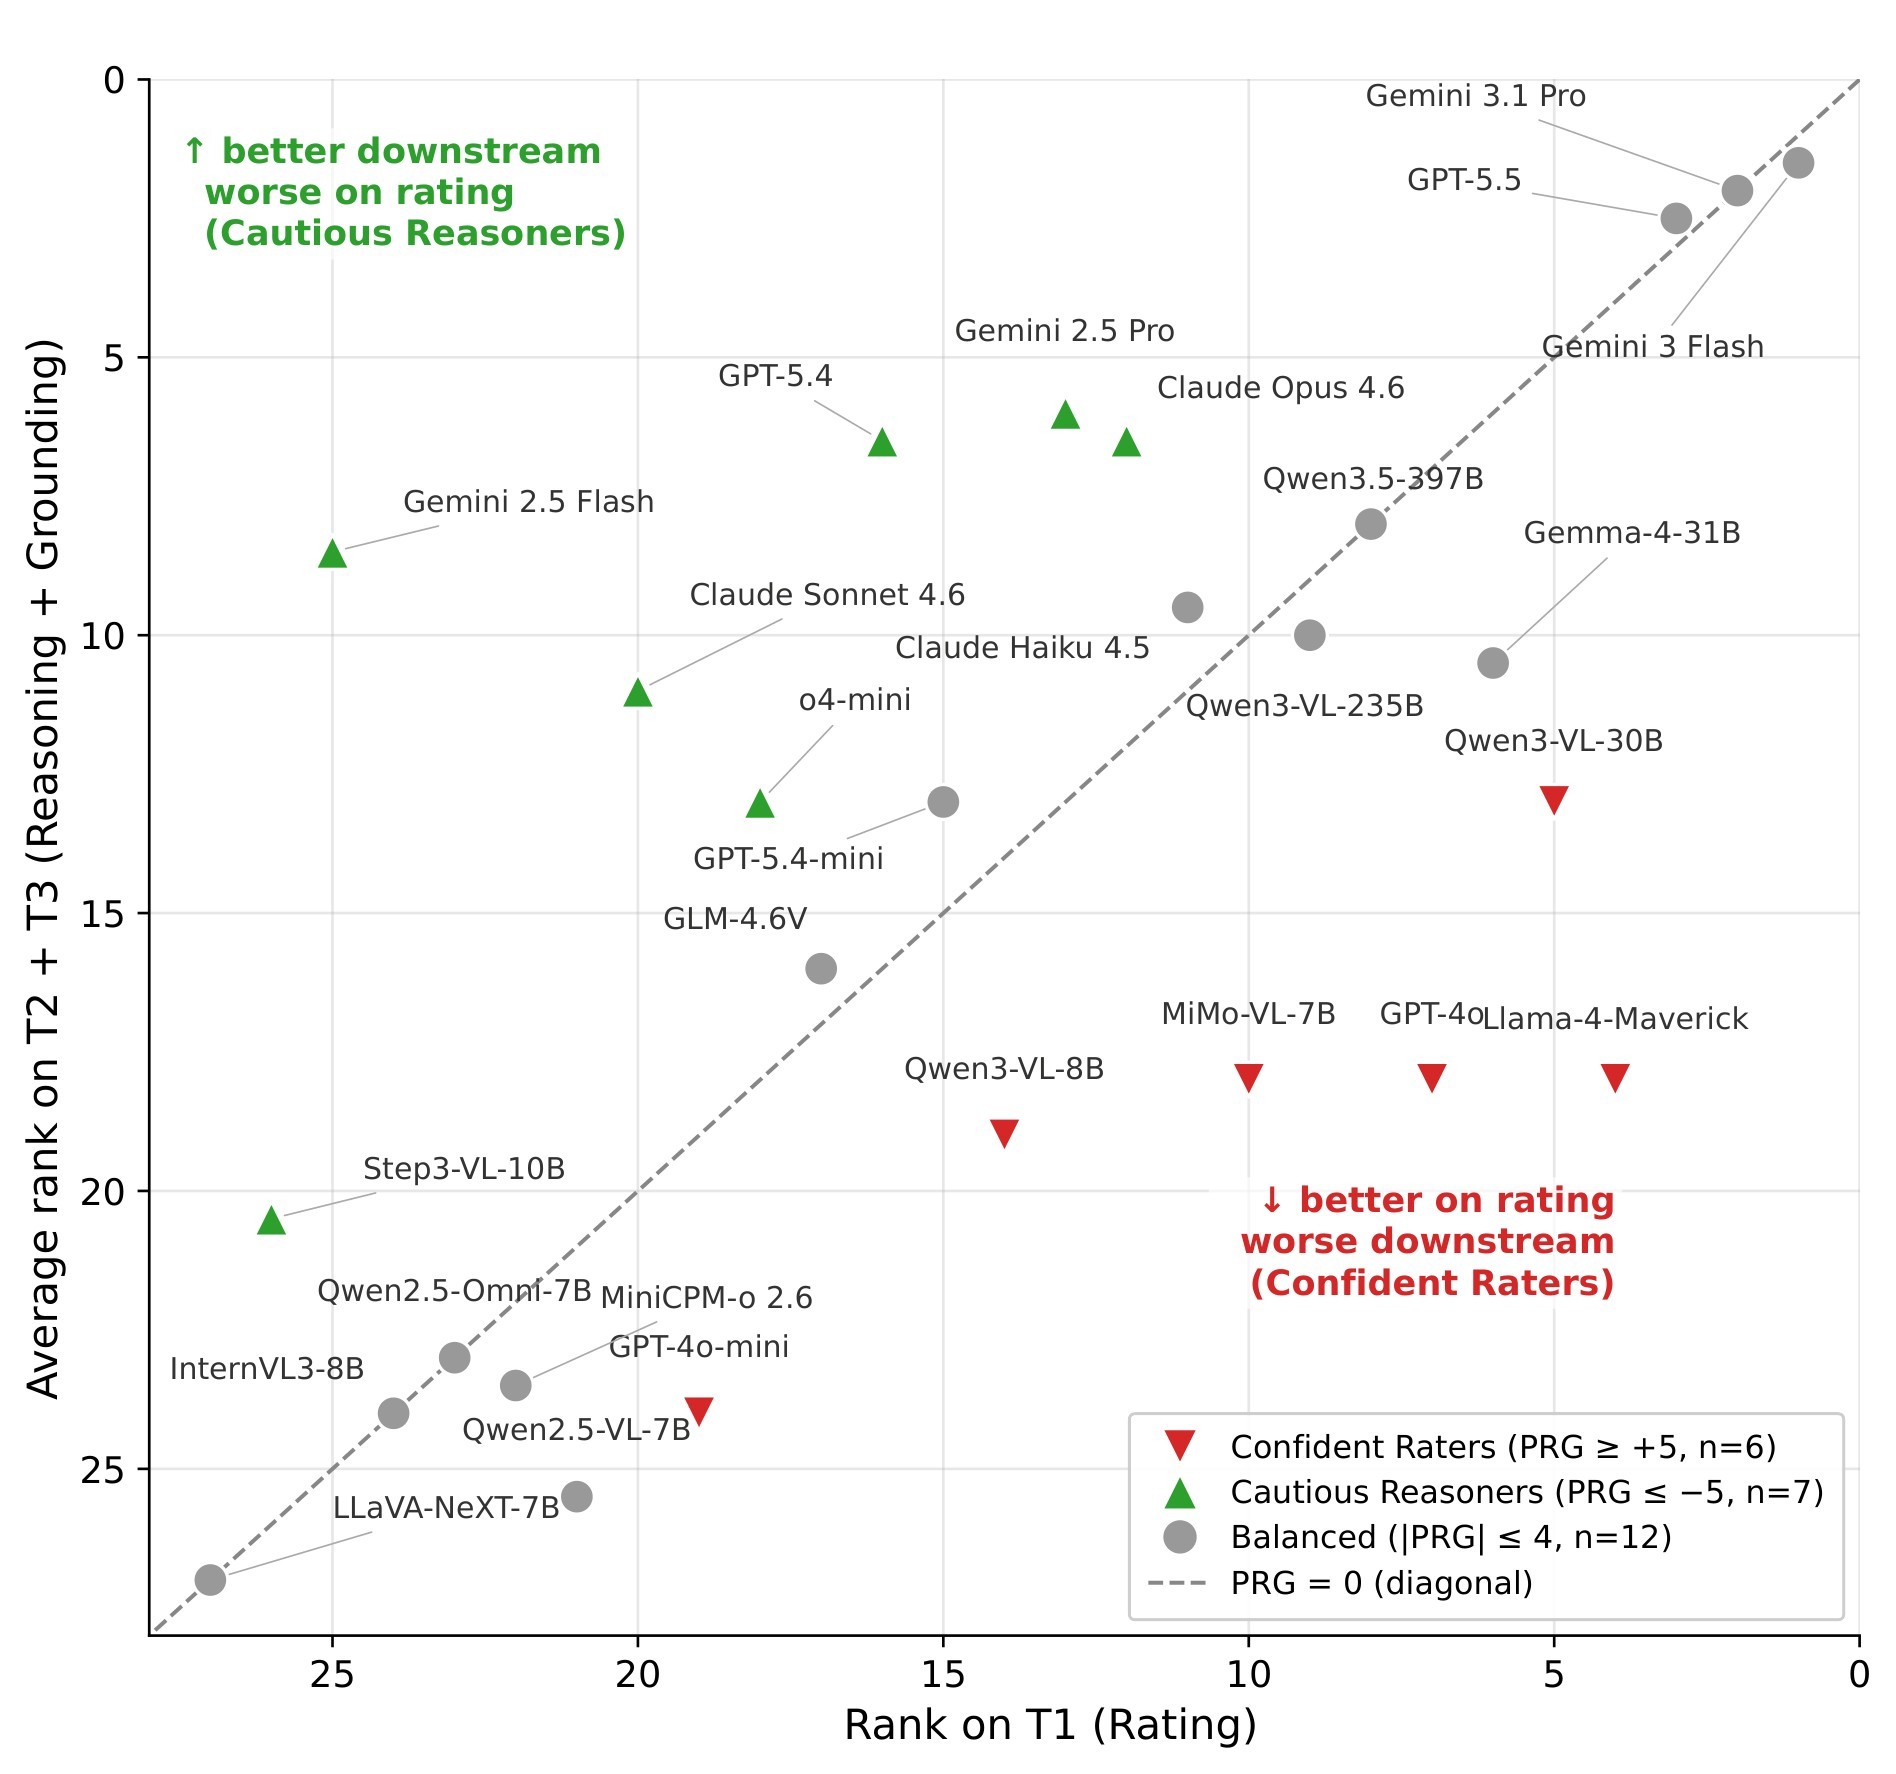
| C6 | HR, RGM, PR, CR, and IR are more diagnostic than single-task scores because they expose different failure modes: confident raters, cautious reasoners, confabulation, and integration failure. | 5 | failure metrics, archetypes, Figure 5, Figure 13 |
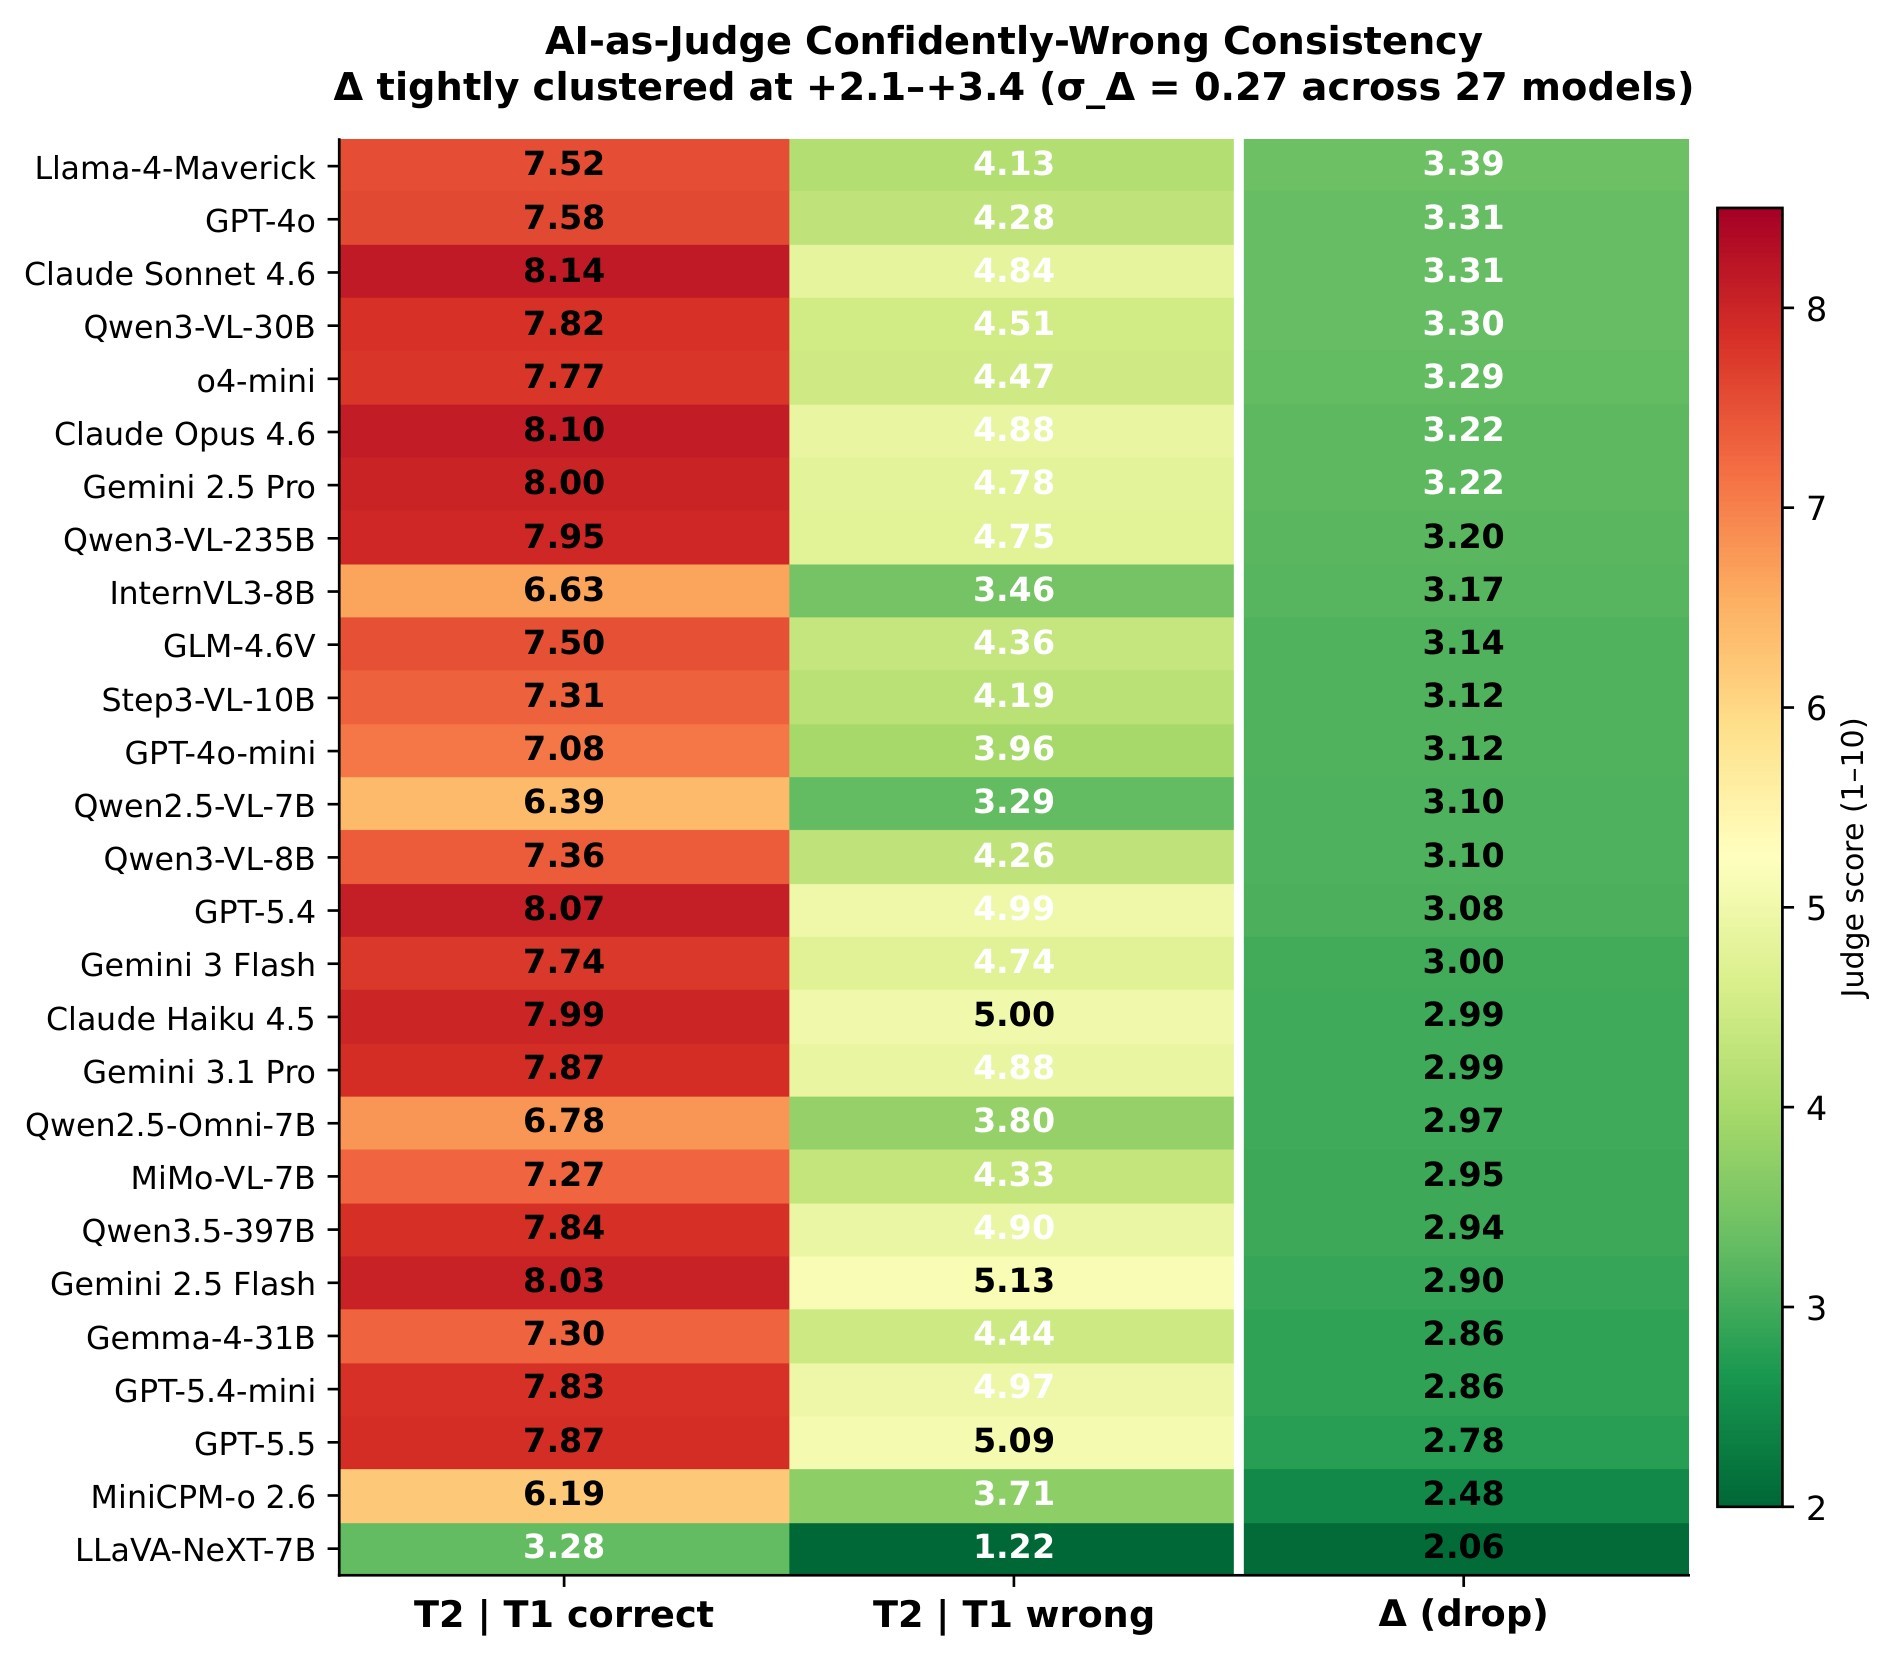
| C7 | The Task 2 AI judge is useful but not definitive; the paper supports it with consistency and cross-judge checks while still listing it as a limitation. | 4 | judge protocol, Figure 7, Table 6 |
| C8 | Practical interpretation should stay conservative because MM-OCEAN uses short, mostly Western-context English videos, MCQ-based grounding, and apparent-personality labels from First Impressions V2. | 5 | limitations and ethics, Table 6 |
Core Technical Idea
The paper reframes personality assessment as evidence-grounded social cognition. The motivating failure is not merely low accuracy; it is a model that says "low extraversion" or "high agreeableness" without locating the behavioral evidence that warrants that judgment. This matters because apparent personality judgments are socially sensitive, and the paper explicitly ties trustworthiness to an evidence trail.
The formal task is built around a short video \(V = (V_{\text{vis}}, V_{\text{aud}}, V_{\text{txt}})\), the Big Five trait set \(\mathcal{T} = \{E, A, C, N, O\}\), and a five-point ordinal label set \(\mathcal{L} = \{1,2,3,4,5\}\). Table 2 and the equations below capture the source paper's key formal objects:
Each observation \(o_k = (d_k, t_k^s, t_k^e, \text{desc}_k, b_k)\) records a perceptual dimension, timestamps, a description, and a body-part tag. Each trait reasoning chain \(r_i = (\ell_i, \mathcal{E}_i, \text{rat}_i)\) must cite at least one valid observation id. That grounding constraint is the key difference from ordinary apparent-personality regression.
| Object | Source label | Digest interpretation |
|---|---|---|
| \( \hat{y}_i \in \mathcal{L} \) | eq:t1 |
T1 asks for one ordinal Big Five level per trait. |
| \( (\hat{\mathcal{O}}, \hat{\mathcal{R}})=f_\theta(V) \) | eq:t2 |
T2 asks for open-ended observations and trait rationales. |
| \( \hat{a}_q \in \{\texttt{A},...,\texttt{F}\} \) | eq:t3 |
T3 asks targeted MCQs over cue-grounding categories. |
| \( \operatorname{Acc}_{T1}, \operatorname{MAE}_{T1} \) | eq:t1_metrics |
Rating quality is exact ordinal match plus distance from the human label. |
| \( S_{T2} \) and \( \overline{S}_{T2} \) | eq:t2_avg4 |
Reasoning quality is judged on evidence coverage, coherence, grounding, and direction. |
| \( \operatorname{Acc}_{T3}^{(c)} \) | eq:t3_metrics |
Grounding can be aggregated overall or by cognitive category. |
| \( \operatorname{RGM}(m) \) and \( \Delta_{Tk} \) | eq:rgm, eq:delta |
RGM detects rating-vs-grounding rank mismatch; \(\Delta\) compares open and closed frontiers. |
| \( \text{PR}, \text{CR}, \text{IR}, \text{HR} \) | eq:PR, eq:HR |
Failure-mode rates decompose whether rating, reasoning, and cue retrieval succeed together. |
| \( \sigma(m) \) | eq:sigma |
Option-letter skew diagnoses positional bias in six-way MCQs. |
Table 2. Key equations. These equations come from equations.json and the source Markdown's task and evaluation sections.
| Component | What the paper evaluates | Why it matters |
|---|---|---|
| T1: ordinal personality rating | Big Five level prediction over \(\mathcal{L}\) | Keeps continuity with older APR benchmarks. |
| T2: open-ended rating reasoning | Evidence coverage, logical coherence, grounding accuracy, and directional accuracy | Tests whether the verbal explanation is behaviorally supported. |
| T3: structured cue grounding | Seven MCQ categories spanning reasoning and visual grounding | Forces retrieval of specific temporal, spatial, expression, and causal cues. |
| Cross-task rates | PR, CR, IR, HR, and RGM | Detects cases where a model gets one stage right but the full chain fails. |
Table 3. Task design digest. The main innovation is the chain, not any one task alone.
The benchmark construction pipeline has five stages, shown in Figure 3. An Observer drafts atomic non-interpretive cues; human annotators verify, correct, localize, or delete those cues; a Psychologist writes Big Five analyses with cited evidence; an Examiner creates seven MCQs per video; and an Aligner plus expert review filters invalid or shortcut-prone questions.
Method Details
MM-OCEAN draws from ChaLearn First Impressions V2, using about 15-second single-speaker clips with crowd-sourced Big Five scores and ASR transcripts. The released benchmark contains 1,104 videos, about 13.5K verified observations, 5,520 trait-level analyses, and 5,320 retained cue-grounding MCQs, averaging 4.8 MCQs per video after filtering. Continuous Big Five scores are discretized into the five ordinal levels used by T1.
The human verification layer is a substantive part of the method. The source reports 24 trained annotators, 45,609 Observer-drafted clues judged, 36,677 bounding boxes drawn, 78.2% accepted as correct, 14.6% corrected, 5.9% deleted, and 605 bonus clues added. The web interface in Figure 6 supports frame-level timestamping and bounding boxes for retained Expression and Action observations.
The diagnostic layer is the most important technical move. The paper first converts each per-video task outcome into binary success indicators:
The defaults are \(\theta_1=\theta_3=0.5\), meaning majority-correct for T1 and T3, and \(\theta_2=0.7\), meaning an acceptable T2 judge score. It then defines the main failure and success rates:
Table 4 summarizes how these rates should be read in the digest.
| Metric | Meaning | Desired direction |
|---|---|---|
| PR: Prejudice Rate | Correct rating but failed cue retrieval | Lower |
| CR: Confabulation Rate | Correct rating but failed reasoning quality | Lower |
| IR: Integration-failure Rate | Correct cue retrieval but wrong rating | Lower |
| HR: Holistic-Grounding Rate | Rating, reasoning, and grounding all succeed | Higher |
| RGM: Rating-Grounding Misalignment | Average T2/T3 rank minus T1 rank | Near zero or negative is better than strongly positive |
Table 4. Diagnostic metrics. These metrics turn benchmark evaluation into a failure taxonomy rather than a single leaderboard.
Task 2 uses GPT-4o-mini as an AI-as-Judge over four dimensions: Evidence Coverage, Logical Coherence, Grounding Accuracy, and Directional Accuracy. The judge sees the model's T2 output, the ground-truth trait level, and the human-verified observations, but not the video. The paper supports this judge with two checks: a "confidently wrong" split where T2 scores drop when T1 is wrong, and a 200-video cross-judge subset with Claude Haiku 4.5 and Gemini 2.5 Flash-Lite. The reported Spearman rank correlations are 0.94 and 0.92.
Experiments And Results
The evaluation covers 27 MLLMs across 12 families, including 13 proprietary and 14 open-source models. The key result is that rating accuracy alone substantially overstates competence. The paper reports mean PR of 51.3%, mean HR of 10.4%, and best HR of 33.5% from Gemini 3 Flash. In other words, more than half of correct ratings are not paired with correct cue retrieval, and even the strongest model only clears the full rating-reasoning-grounding chain on about one third of samples.
The paper's main quantitative claims are condensed in Table 5. Figure 4, Figure 11, and Figure 12 provide the visual diagnostics behind those claims.
| Result family | Source-reported number | Digest interpretation |
|---|---|---|
| Mean Prejudice Rate | 51.3% | Most correct ratings lack correct cue retrieval. |
| Mean Holistic-Grounding Rate | 10.4% | Full-chain success is rare across the model field. |
| Best HR | 33.5% | Even the best model leaves most samples not fully grounded. |
| Closed frontier PR | about 14.5% | Frontier closed models reduce but do not remove ungrounded correct ratings. |
| Open frontier PR | about 47.0% | Open models retain a much larger cue-grounding deficit. |
| Open-vs-closed T1 gap | -5.6 percentage points | Rating has largely narrowed across ecosystems. |
| Open-vs-closed T2 gap | -3.6 percentage points | Verbal explanation quality is closer than grounding. |
| Open-vs-closed T3 gap | -26.6 percentage points | Cue retrieval is the main remaining ecosystem gap. |
| Hardest T3 categories | Spatial Localization 30.7%, Micro-expression Localization 34.6% | Fine-grained perceptual localization is the bottleneck. |
| Easiest T3 category | Temporal-Causal Reasoning 64.8% | Higher-level reasoning categories are easier than visual localization. |
Table 5. Main results digest. These values come from the source Markdown's benchmarking section and appendix summaries.
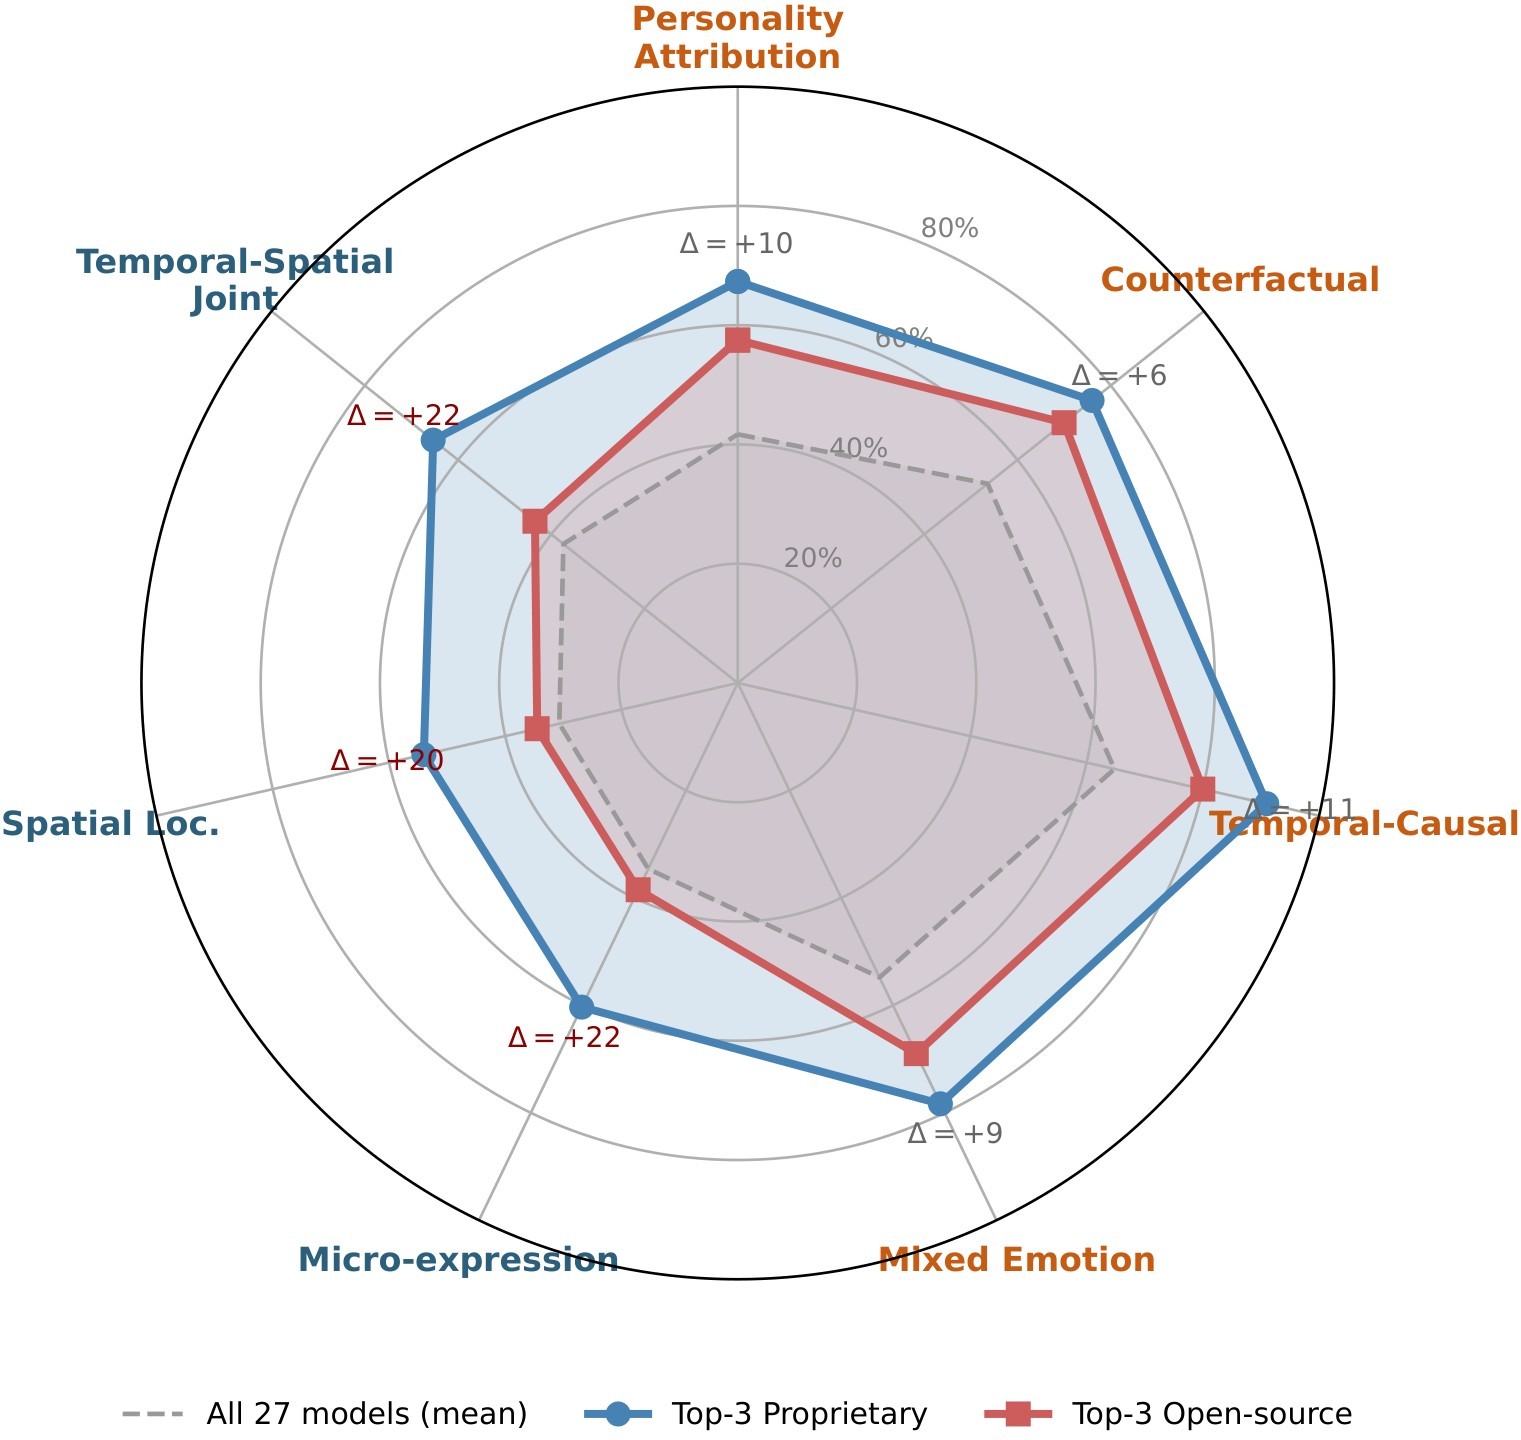
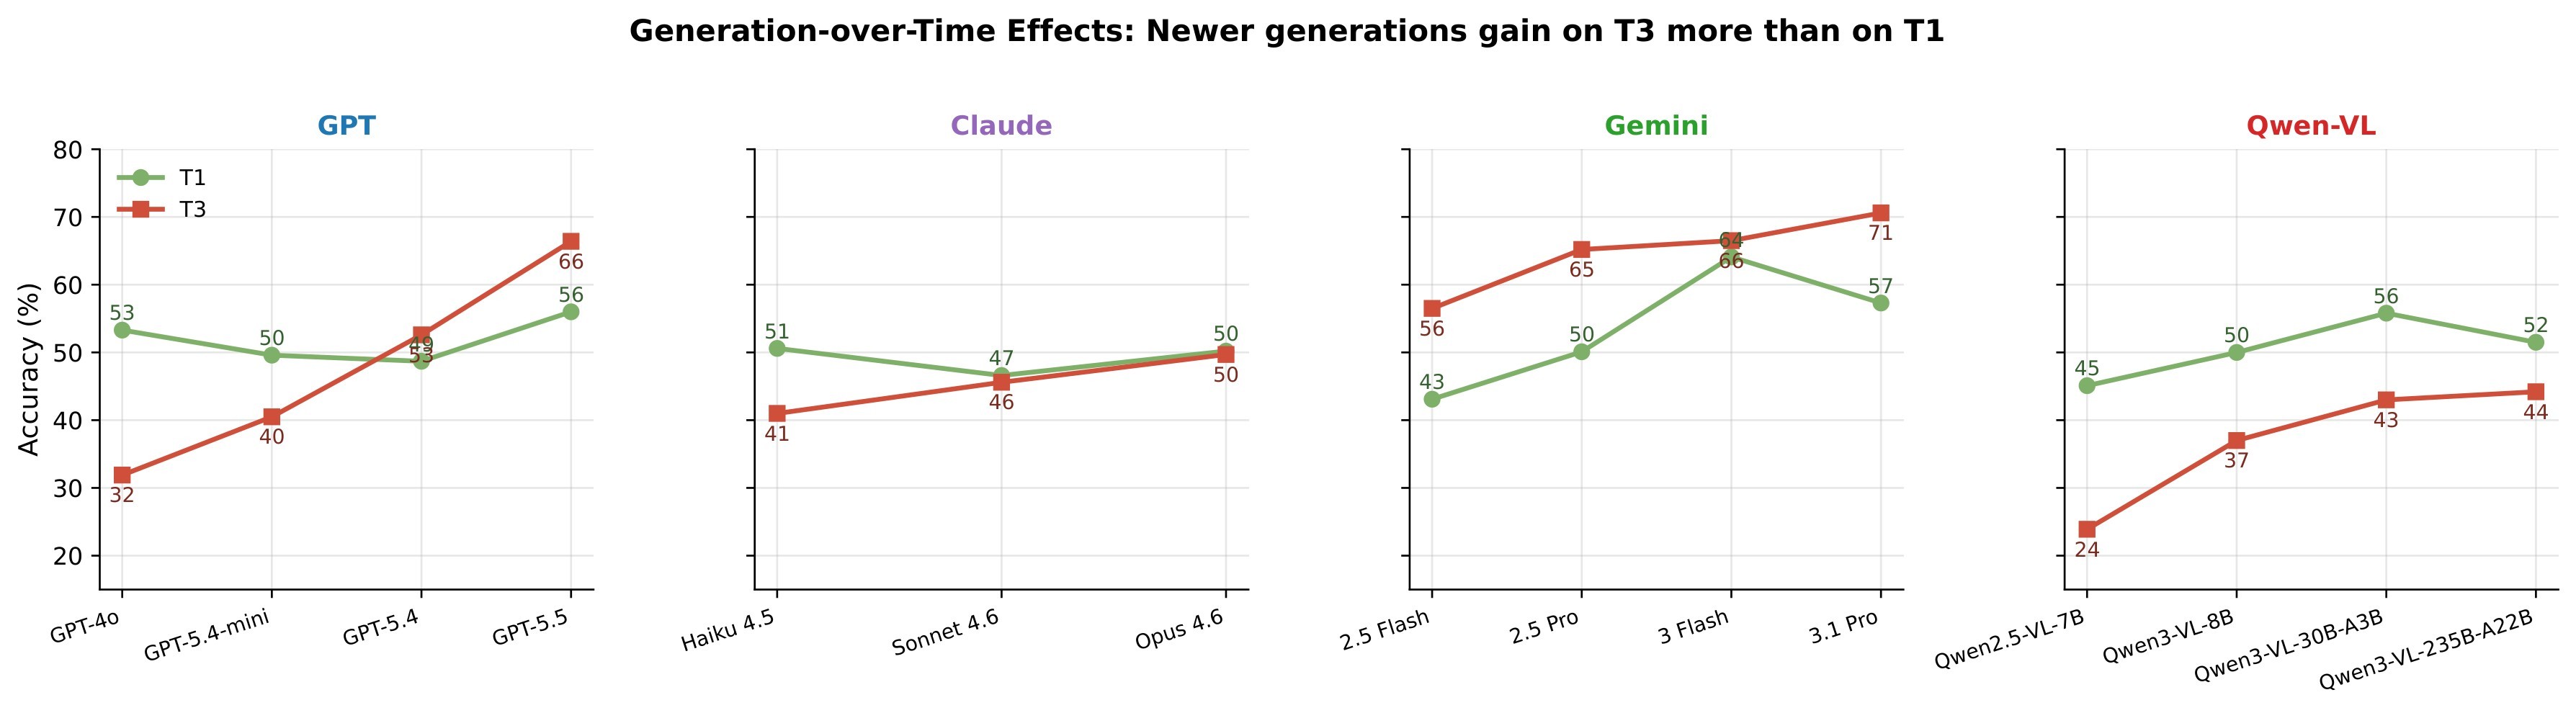
The per-category analysis shows that MLLMs are much better at verbal or temporal reasoning than at localizing fine visual evidence. The paper reports a Top-3 closed advantage of +19.5 percentage points on Spatial Localization and +21.8 points on Temporal-Spatial Joint, compared with +6 to +11 points across reasoning-cluster categories. Even Gemini 3.1 Pro reaches only 57% on Spatial Localization and 71% on Temporal-Spatial Joint.
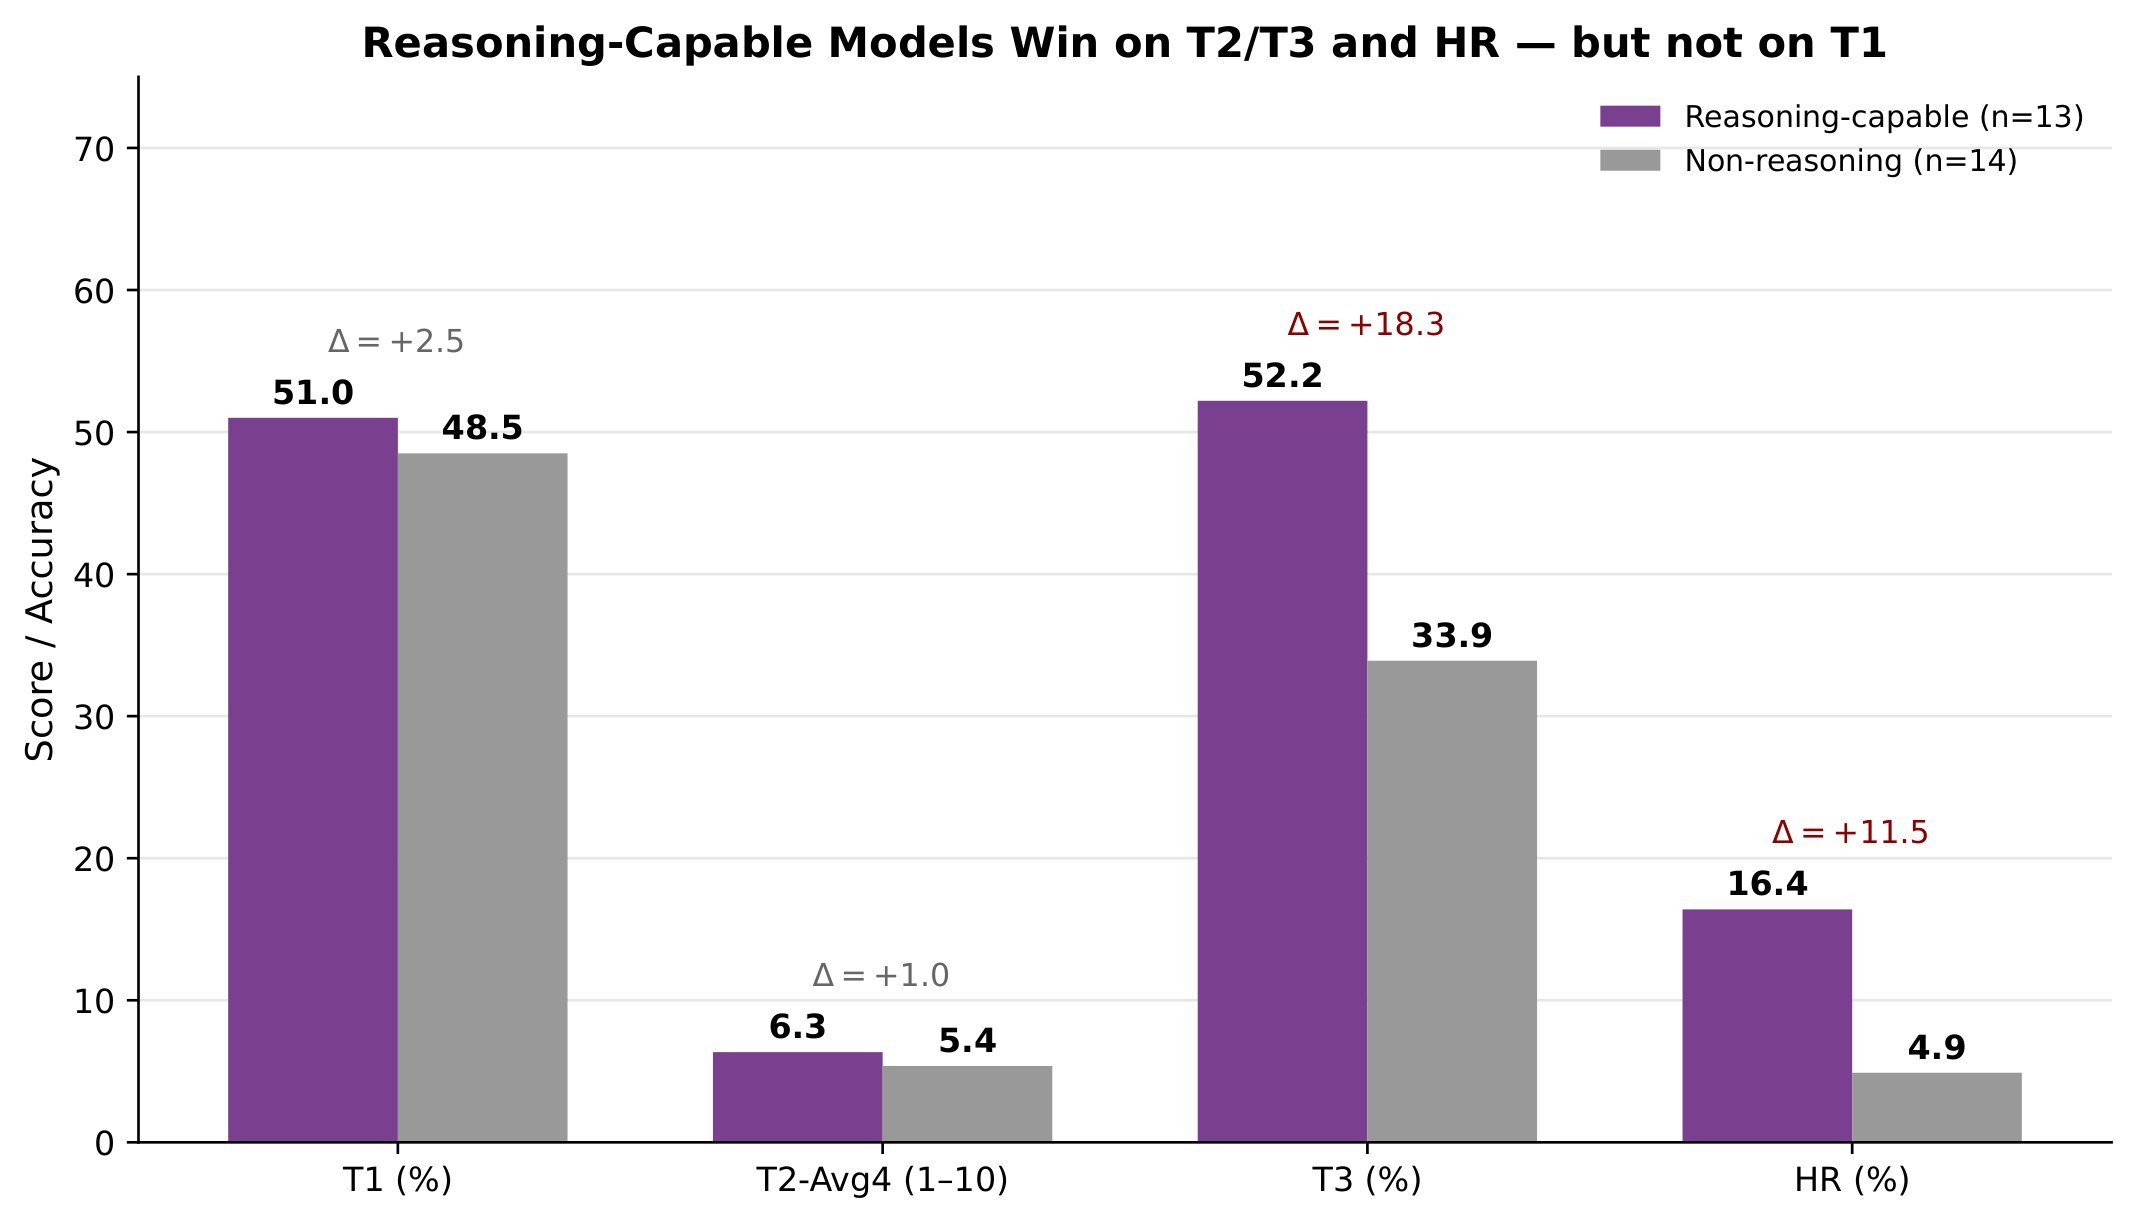
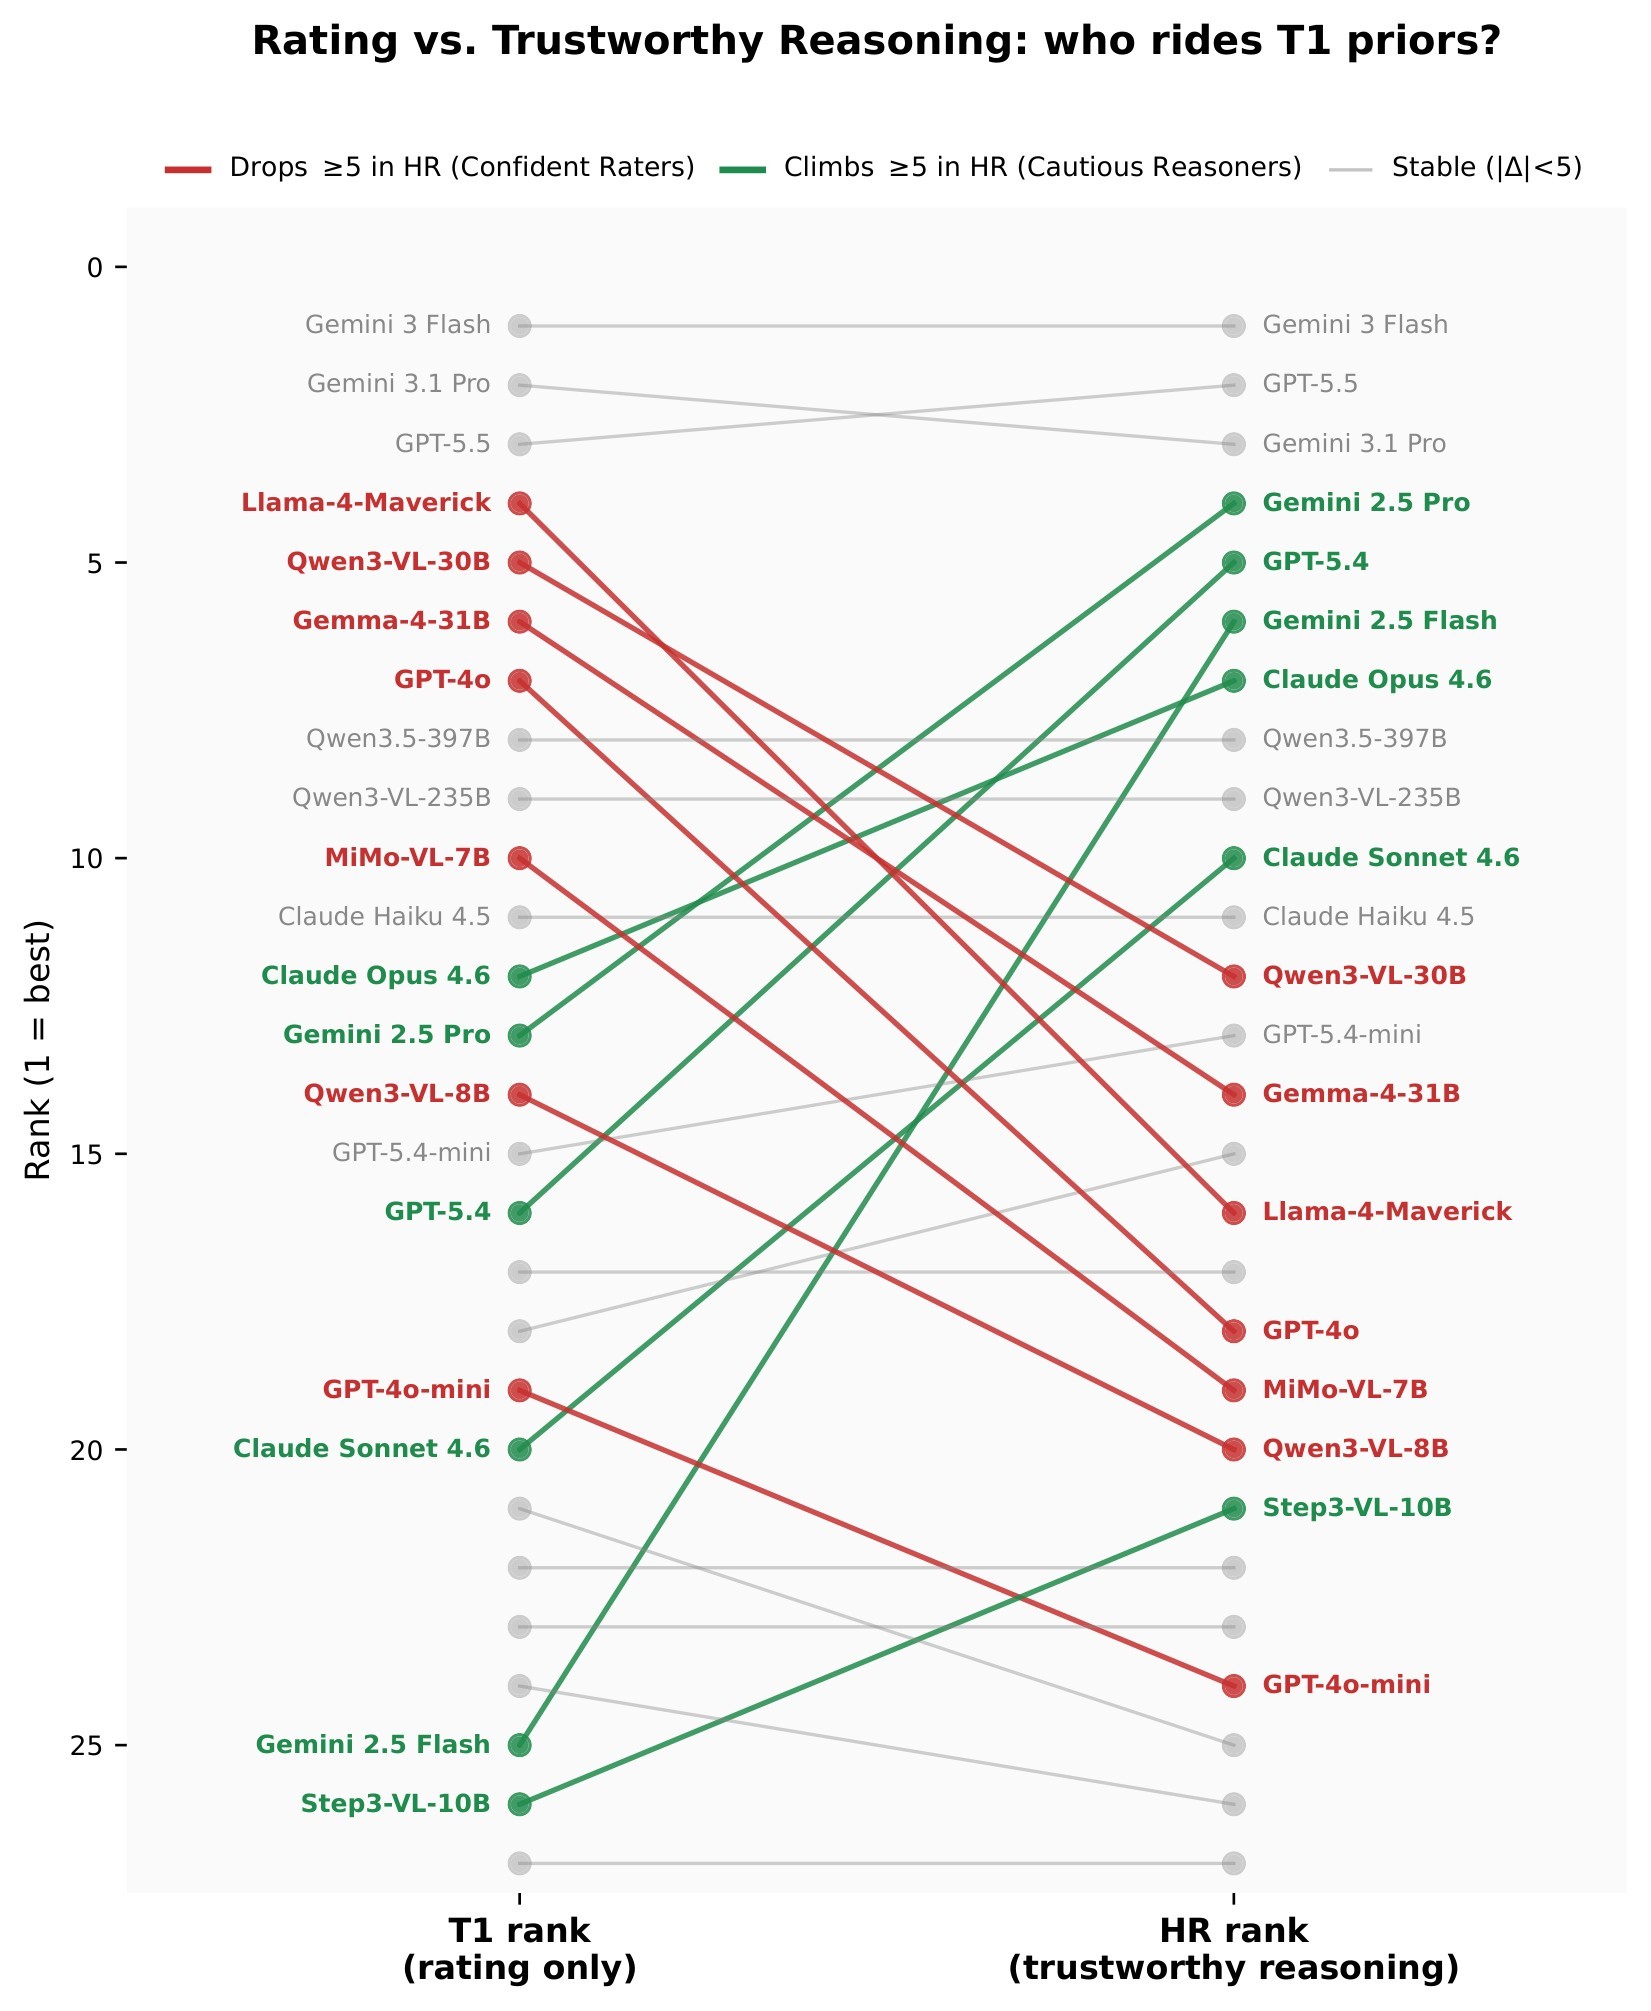
The paper uses RGM and HR to show that the failure modes are not uniform. "Confident raters" rank high on T1 but fall on T2/T3; "cautious reasoners" rate less accurately but retrieve and reason about evidence better. The source example is useful: Llama-4-Maverick-FP8 ranks 4 on T1 but 17/19 on T2/T3, while Gemini 2.5 Flash ranks 25 on T1 but 5 on HR. Figure 13 visualizes these rank shifts.
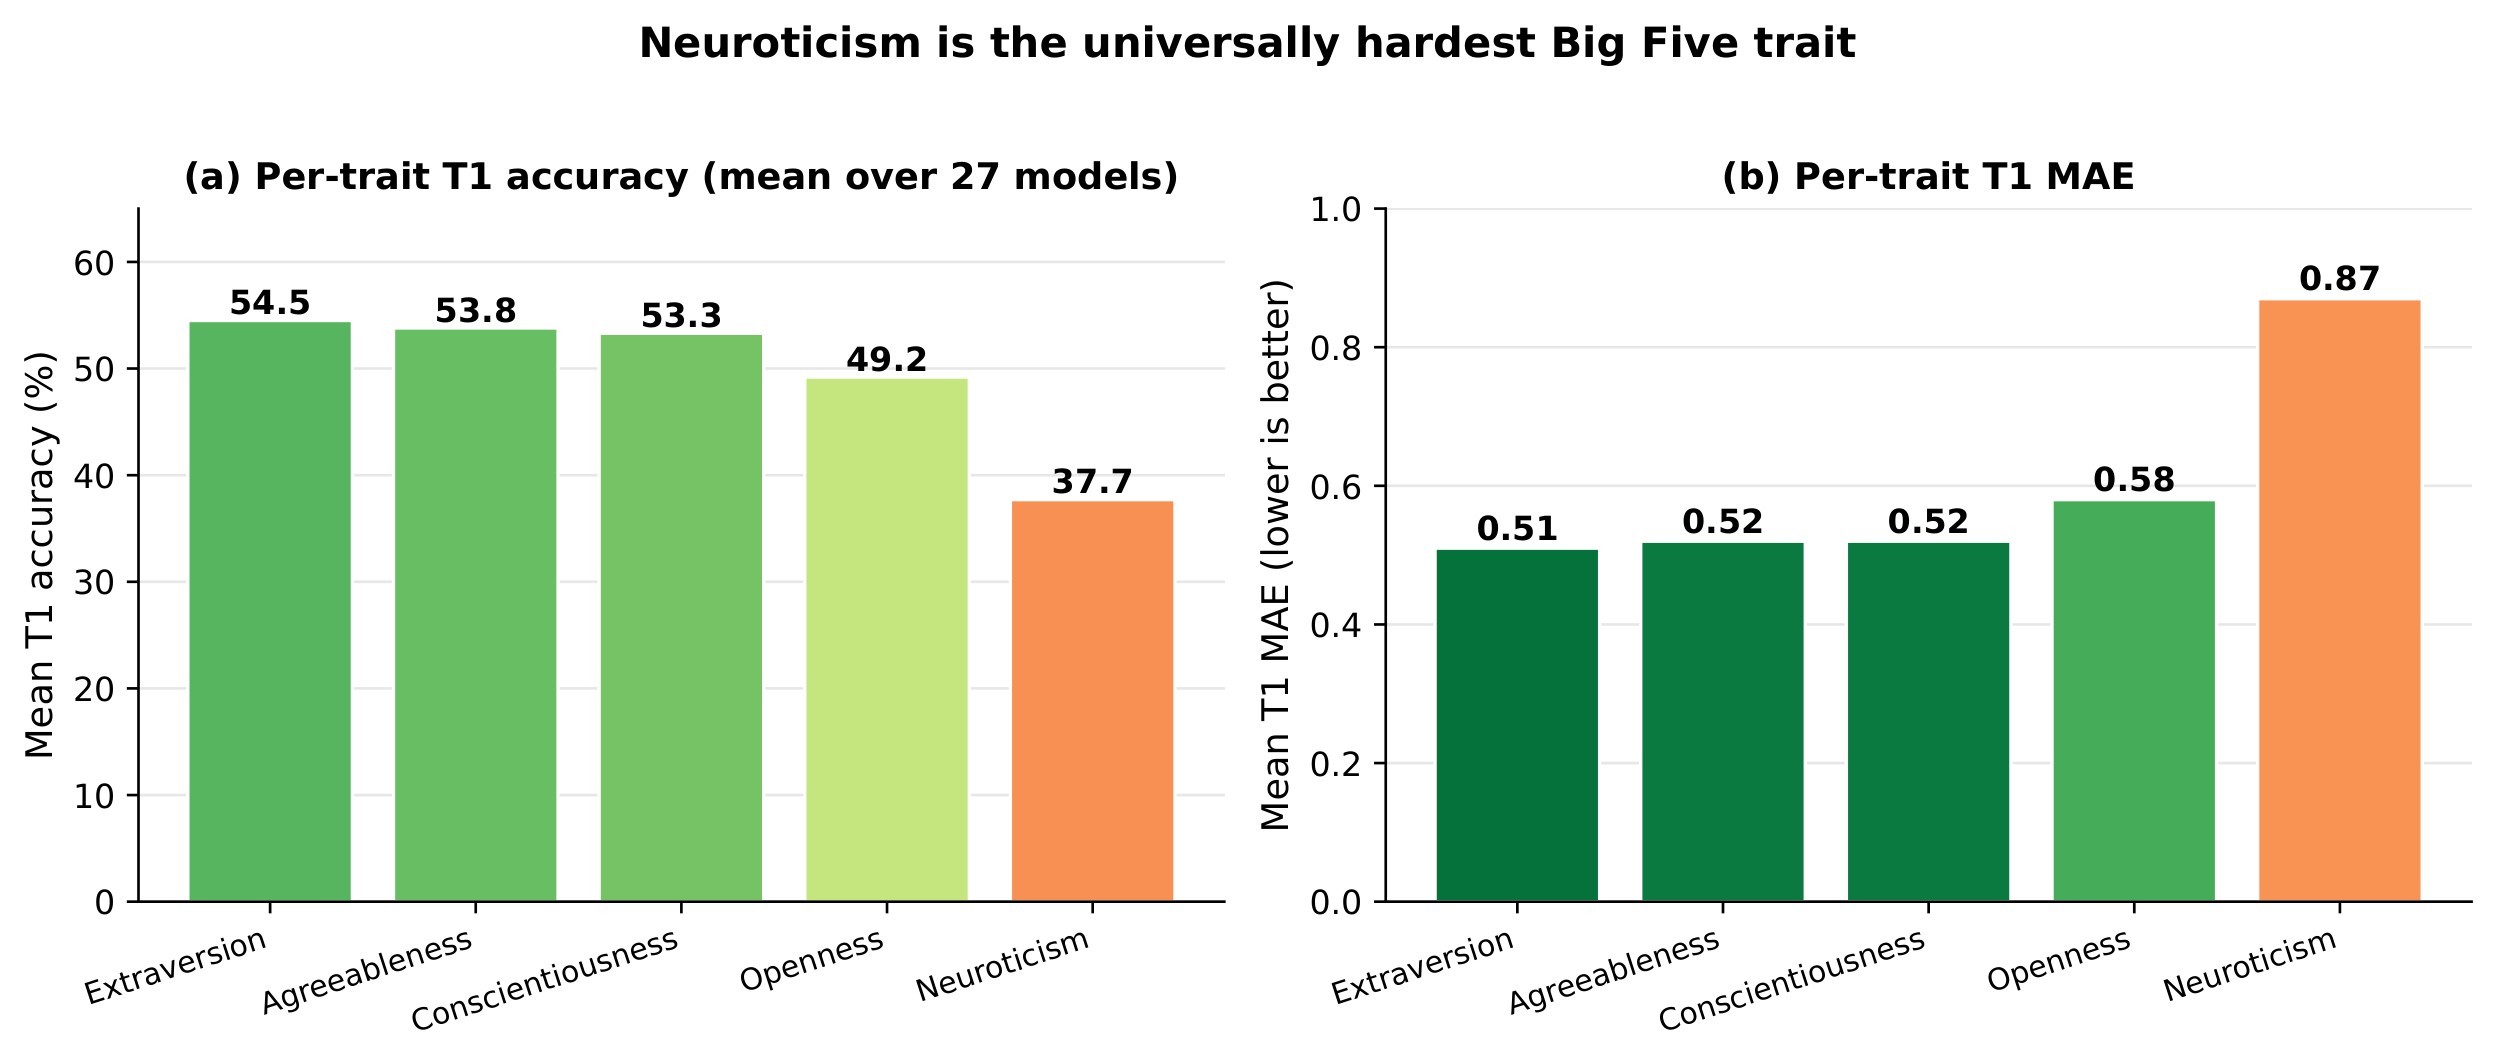
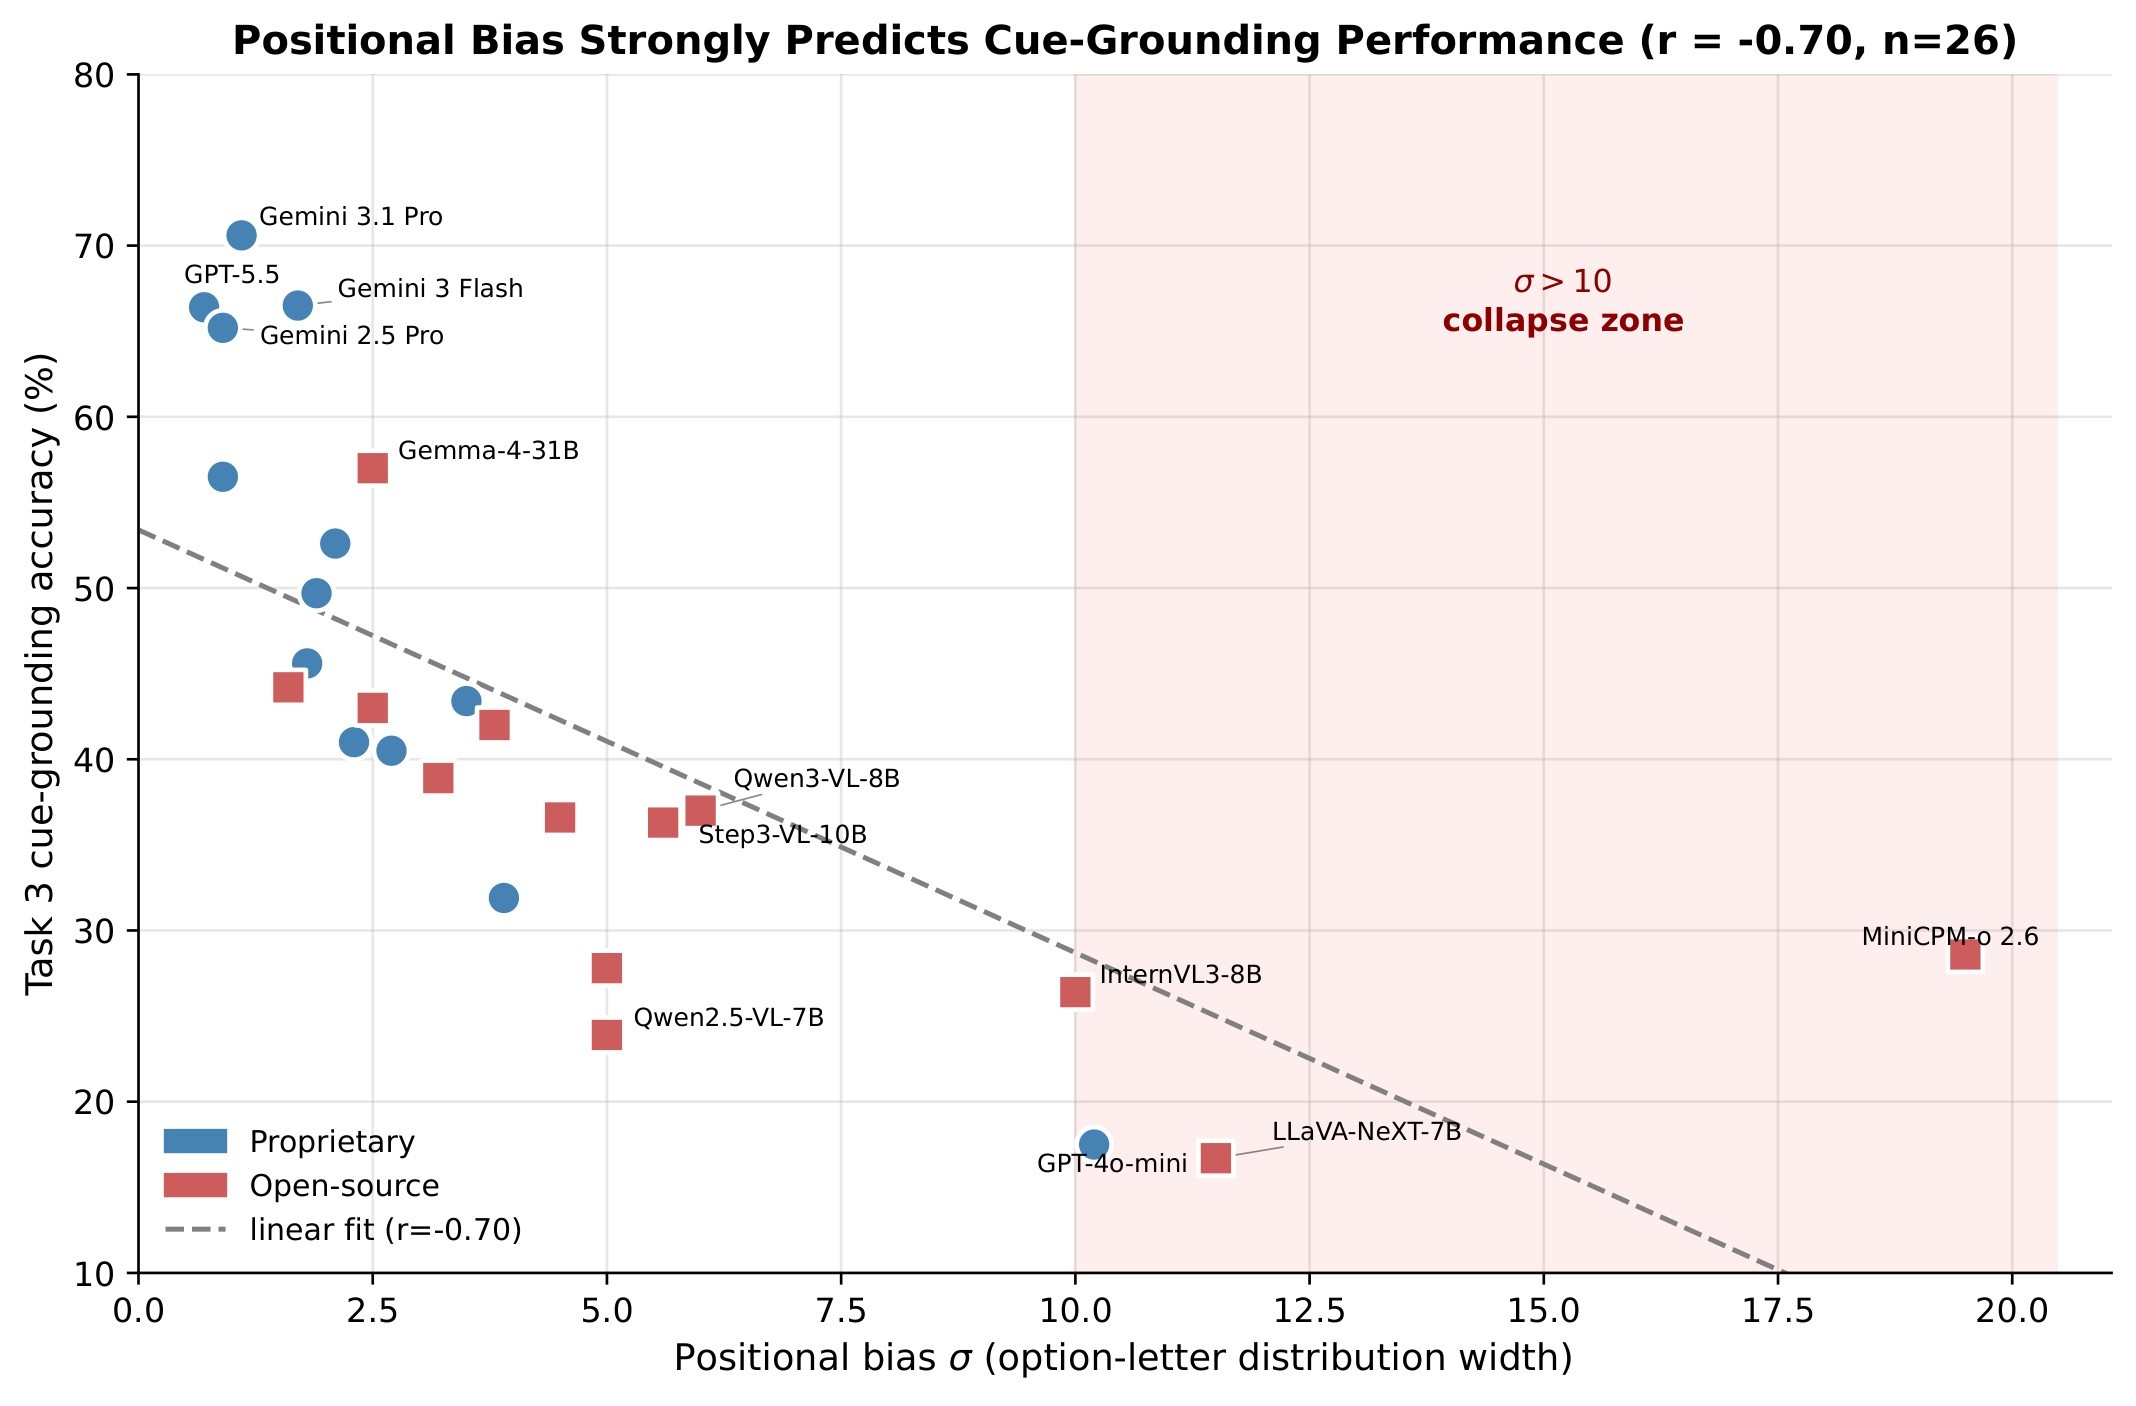
The appendix adds several diagnostics that make the benchmark more useful than the headline leaderboard alone. The threshold sweep reports HR rank correlation from 0.925 to 1.000 across 27 threshold settings, except a harsher T2 threshold that makes the top ranks noisier. The paper also reports that T2 Evidence Coverage is the hardest judge dimension, with mean 5.14, while Grounding Accuracy and Logical Coherence are easier. A positional-bias statistic \(\sigma\) flags models that overuse MCQ option letters:
The worked example makes the core failure concrete. On a video where the ground-truth trait is Low Extraversion, both GPT-4o and Gemini 3 Flash produce the right rating and plausible verbal explanations. But the cue-grounding MCQ asks about the behavioral window from 4.9 to 8.7 seconds, where the subject's gaze drifts down and left while speech continues. Gemini 3 Flash selects the low-extraversion answer tied to internally focused processing; GPT-4o selects the wrong option. That is exactly the source definition of prejudice: correct rating, failed cue retrieval.
Practical Takeaways
The practical lesson is not that MLLMs are ready for personality scoring. It is the opposite: the benchmark shows why rating-only evaluations are unsafe as evidence of trustworthy social understanding. Table 6 collects the paper's main caveats.
| Caveat | Why it matters for use |
|---|---|
| Apparent personality only | The labels come from First Impressions V2 and should not be treated as objective psychometric ground truth. |
| Short single-speaker English clips | Cross-cultural, multilingual, multi-person, and long-context behavior are not covered. |
| Western-context source data | The dataset may inherit cultural and linguistic bias. |
| AI-as-Judge for T2 | The paper validates judge stability, but high-stakes use would need human or multi-judge review. |
| MCQ-based grounding | T3 measures retrieval over predefined cues; high PR may partly reflect MCQ design choices. |
| Misuse risks | Automated personality assessment can enable discriminatory screening, surveillance, or over-claimed validity. |
Table 6. Limitations and responsible-use caveats. These caveats come from the discussion, datasheet, and ethics sections.
For a researcher building future MLLMs, the paper points to a concrete improvement target: strengthen fine-grained visual and temporal cue grounding, especially spatial localization, temporal-spatial joint reasoning, micro-expression localization, and evidence coverage. For an evaluator, the takeaway is to report full-chain success, not just T1 rating. For an application developer, the takeaway is to avoid treating a plausible personality explanation as evidence unless the model can cite and localize the behavior that supports it.
Reference Coverage
Anchor coverage for evidence links: problem framing, task formulation, dataset pipeline, dataset statistics, annotation protocol, failure metrics, judge robustness, prejudice gap, category diagnostics, archetypes, appendix diagnostics, worked example, and limitations and ethics.
Anchor coverage for tables: claims, key equations, task design, diagnostic metrics, results summary, and limitations.
Anchor coverage for figures: Figure 1, Figure 2, Figure 3, Figure 4, Figure 5, Figure 6, Figure 7, Figure 8, Figure 9, Figure 10, Figure 11, Figure 12, Figure 13, Figure 14, Figure 15, and Figure 16.