Source-first digest for monthly 2026_05 rank 10, rank_id p019.
- Routing status:
success, routefull_markdown - PDF extraction: not used
Motivation / Background
The paper addresses a specific bottleneck for generalized GUI agents: strong models need trajectories that connect instructions, visual observations, actions, coordinates, and multi-step state changes, but existing datasets are usually manually labeled, simulator-bound, platform-specific, or too small. The source comparison in Table 1 frames WildGUI as the scale jump: it covers website, mobile, and desktop environments with 12.7M instructions, 124.5M images, and 9.7 average turns.
The core bet is that internet tutorial videos already contain broad, real user behavior. The missing piece is not more manual labeling; it is an automated Video2GUI pipeline that can filter videos, extract task trajectories, and spatially ground actions. The overview in Figure 1 shows the three stages: coarse-to-fine video filtering, trajectory extraction, and action spatial grounding.
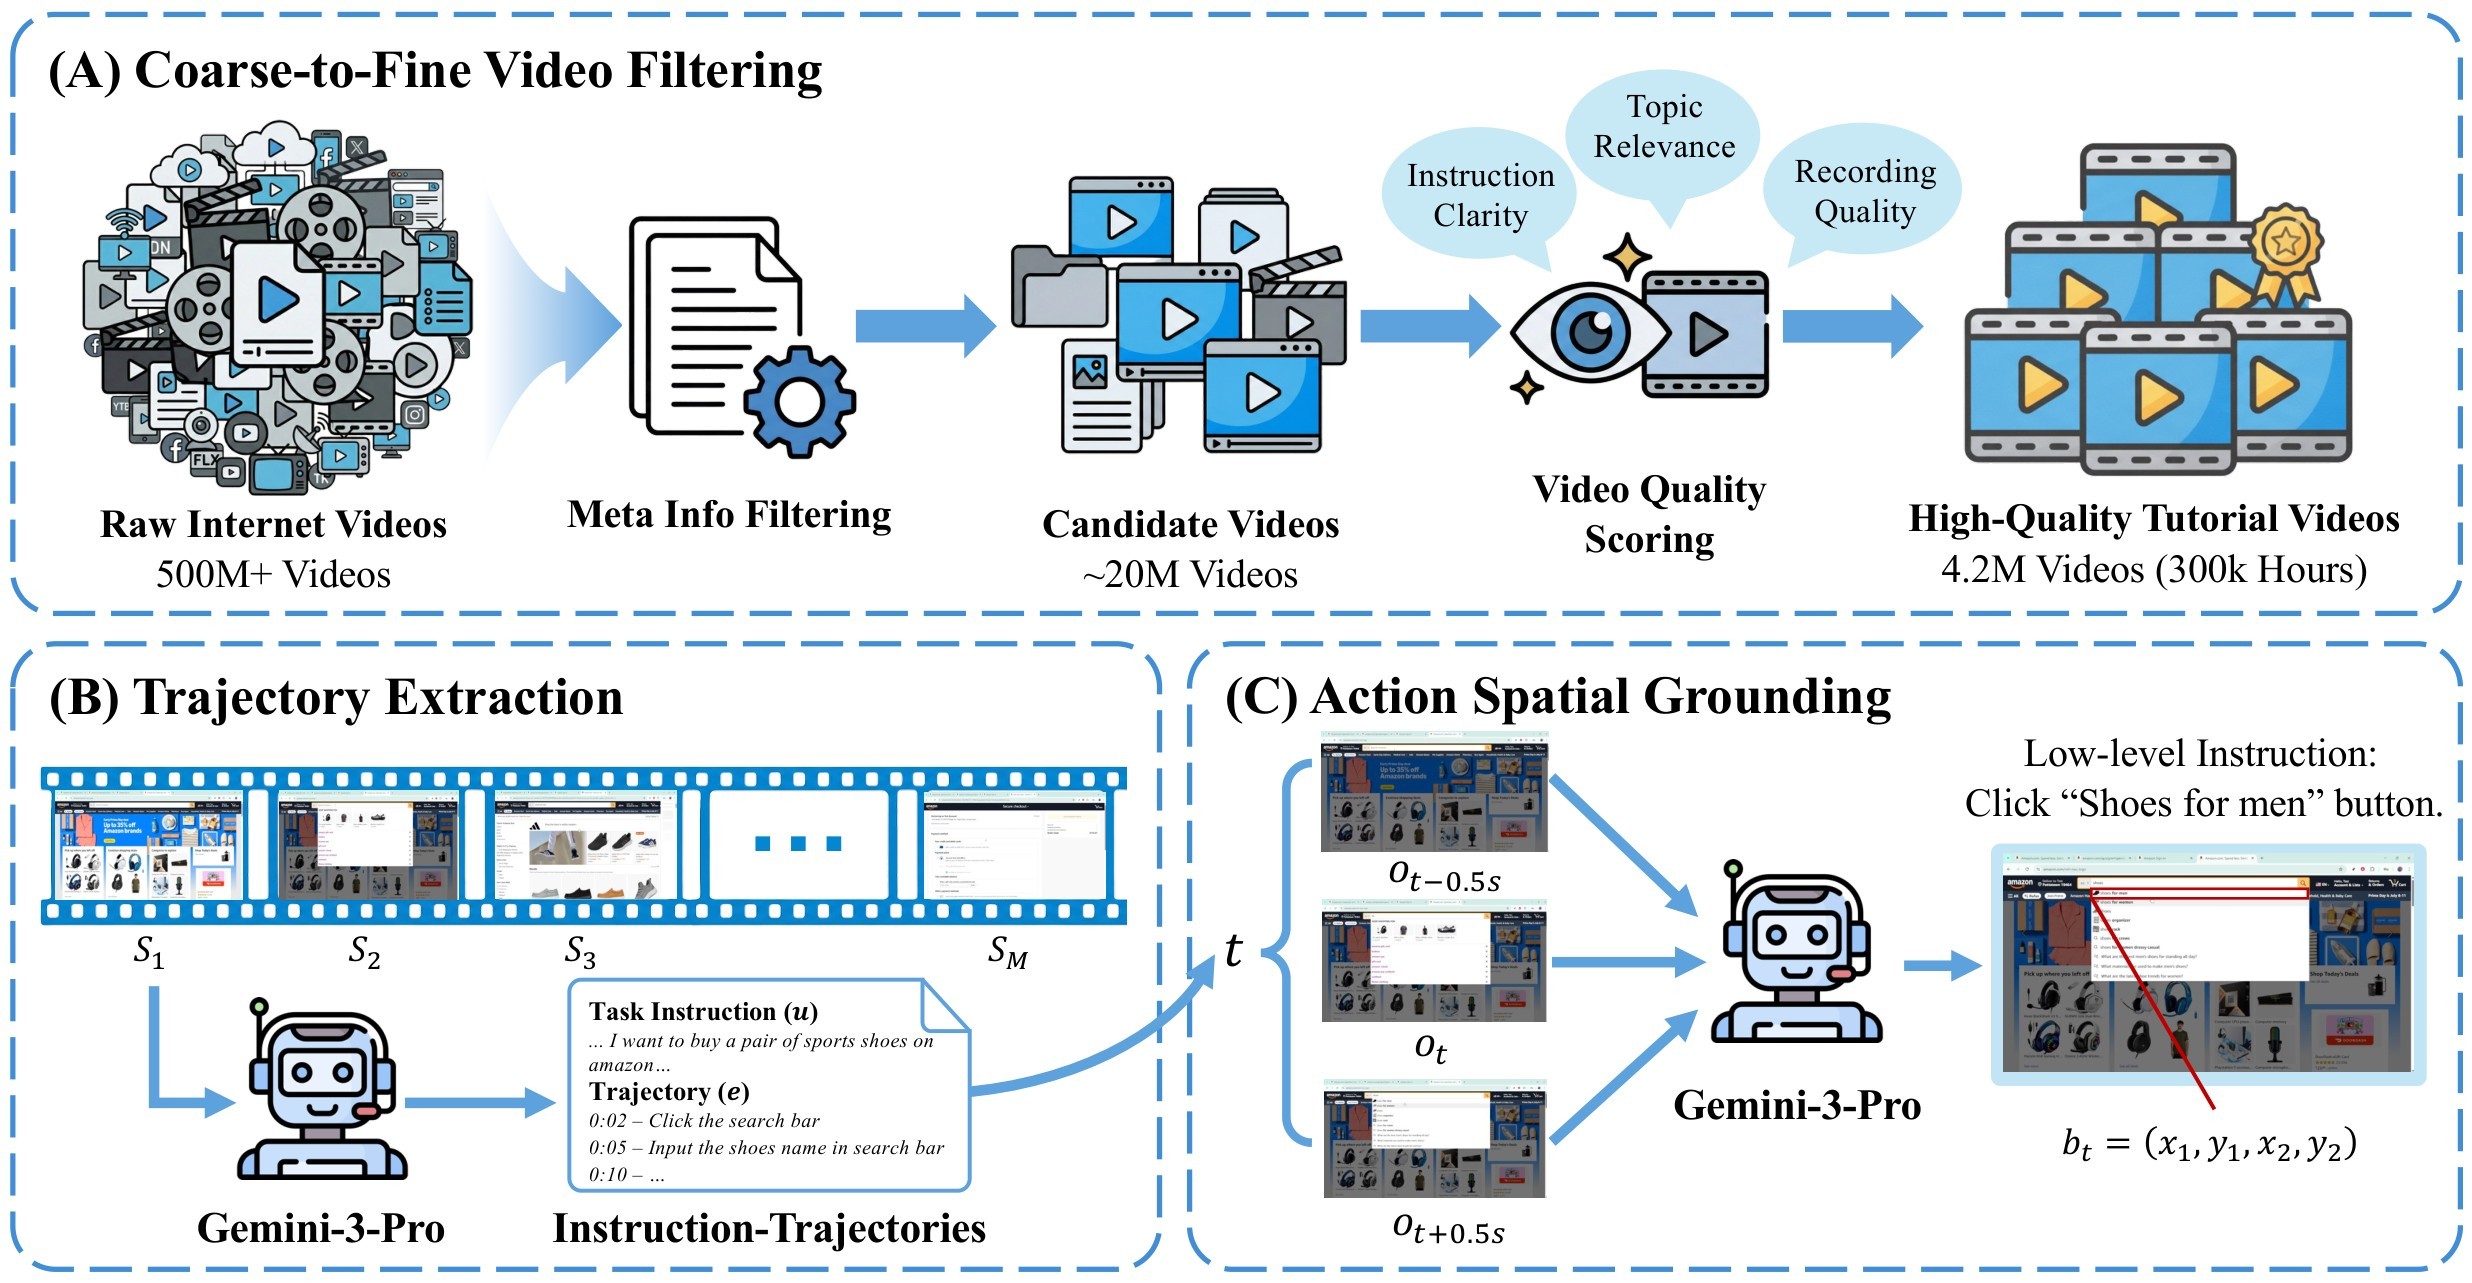
The authors start from over 500M YouTube metadata entries, reduce the pool to about 20M videos through metadata filtering, then retain 4.16M high-quality videos, about 300K hours, after content scoring. From that source pool, they construct WildGUI, a GUI pretraining dataset with 12.7M trajectories spanning more than 1,500 applications and websites.
| Dataset | Website | Mobile | Desktop | Environments | Instructions | Images | Avg turns | Instruction level |
|---|---|---|---|---|---|---|---|---|
| MiniWoB++ | Y | Y | N | 114 | 100 | 17,971 | 3.6 | Low-level |
| MIND2WEB | Y | N | N | 137 | 2,350 | 2,350 | 7.3 | High-level |
| AITW | N | Y | N | 357 | 30,378 | 715,142 | 6.5 | High and low |
| AndroidControl | N | Y | N | 833 | 14,538 | 15,283 | 4.8 | High and low |
| GUI-Net | Y | Y | Y | 280 | 1M | 1M | 4.7 | High-level |
| WildGUI | Y | Y | Y | 1,500+ | 12.7M | 124.5M | 9.7 | High and low |
Table 1. Dataset scale comparison. The table is a compact transcription of the source dataset-comparison table, keeping representative baselines and the WildGUI row.
Claims And Evidence
| Claim id | Main claim | Support | Evidence anchors |
|---|---|---|---|
| C1 | GUI-agent progress is data-limited because existing trajectory datasets are costly, narrow, or hard to scale. | 5 | problem framing, dataset comparison |
| C2 | Video2GUI is a plausible automated source-first pipeline: metadata filtering narrows the web-scale pool, video scoring keeps high-quality tutorials, trajectory extraction creates instruction-action records, and spatial grounding attaches coordinates. | 4 | video filtering, trajectory and grounding, pipeline figure |
| C3 | WildGUI is substantially larger and broader than prior GUI-agent datasets, with 12.7M trajectories, 124.5M screenshots, and coverage across 1,500+ apps and websites. | 5 | dataset scale, dataset table, dataset statistics figures |
| C4 | Continual pretraining on WildGUI improves GUI grounding, offline agent, and online agent benchmarks for both Qwen2.5-VL and Mimo-VL. | 5 | training objective, grounding results, offline results, online results |
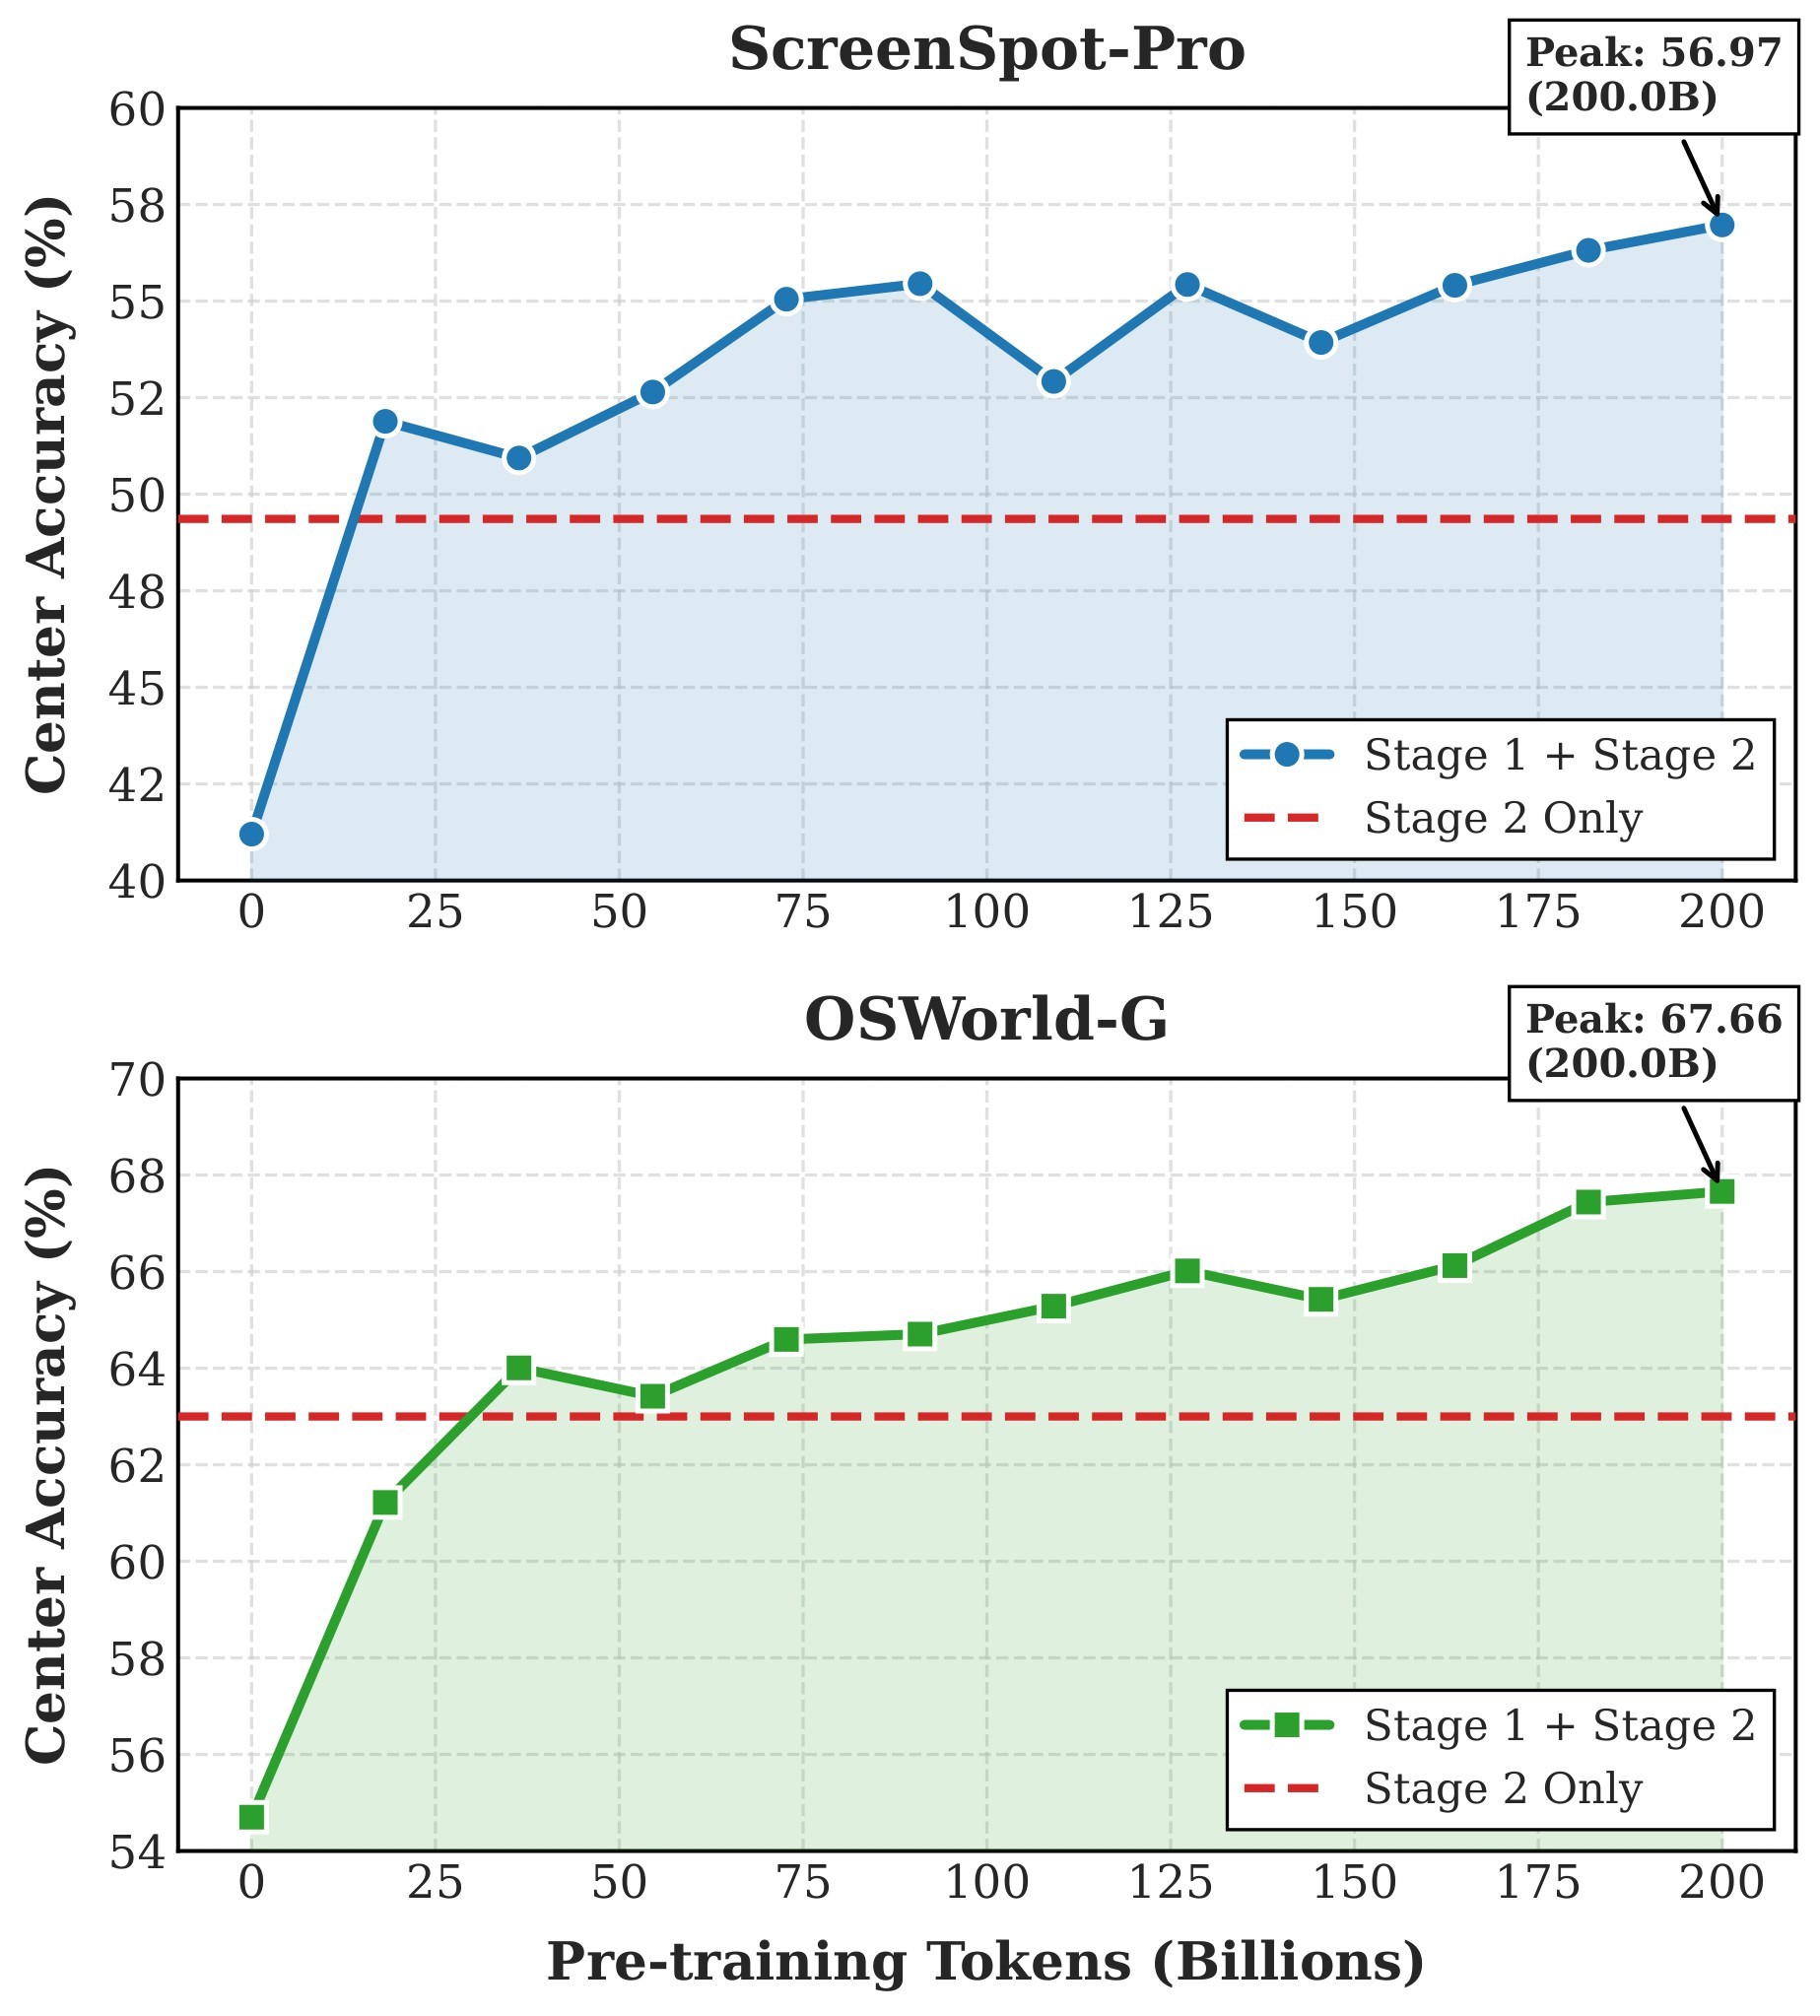
| C5 | Scaling WildGUI pretraining data up to 200B tokens continues to improve ScreenSpot-Pro and OSWorld-G, without clear saturation in the reported range. | 4 | scaling analysis, scaling figure |
| C6 | The three pretraining losses and the two-stage training recipe matter, especially trajectory modeling for online AndroidWorld and Stage 2 alignment for instruction following. | 4 | ablation evidence, ablation table |
| C7 | The pipeline is useful but not free: its highest-quality setting depends on Gemini-3-Pro annotation/grounding, expert-validated filters, and a one-time construction cost. | 4 | data quality evidence, video scoring table, cost caveats |
Support scores are support-from-paper scores, not independent reproduction scores. A score of 5 means the claim is directly backed by the paper's definitions, tables, or experiments; a score of 4 means the paper presents substantial evidence but still relies on internal model annotation, filtering thresholds, or non-public release assumptions.
Core Technical Idea
The coarse-to-fine filtering stage is built to avoid downloading and processing internet video blindly. First, a metadata classifier is trained from 10K DeepSeek-V3-labeled samples and applied to more than 500M YouTube metadata records, reducing the candidate pool to about 20M. Second, a Qwen2.5-Omni video quality scorer is trained on about 200 hours of Gemini-3-Pro-labeled video, scoring the first minute of each candidate for topic relevance, instruction clarity, and recording quality. The paper then keeps videos scoring at least 4.2 on all three dimensions, giving 4.16M videos and about 300K hours. Table 2 summarizes the filter.
| Stage | Model / signal | Training or annotation source | Output scale |
|---|---|---|---|
| Metadata filter | Qwen2.5-7B classifier head | 10K video metadata records labeled by DeepSeek-V3, with upsampling for positives | 500M+ metadata entries to about 20M candidates |
| Video quality scorer | Qwen2.5-Omni with three regression heads | About 200 hours labeled by Gemini-3-Pro across topic relevance, instruction clarity, recording quality | 20M candidates to 4.16M videos |
| Quality threshold | Minimum 4.2 on all three dimensions | Manual verification and scorer test set | About 300K hours of high-quality GUI tutorial content |
Table 2. Coarse-to-fine video filtering. The filter trades cheap metadata pruning against more expensive visual/audio scoring only after the candidate pool is smaller.
The trajectory extraction stage asks Gemini-3-Pro to turn each tutorial video into task-level instruction-trajectory pairs. For a video \(V\), the extracted data are:
Each \(u^{(k)}\) is a natural-language task instruction and each \(e^{(k)}\) is an interaction trajectory with timestamped steps. Long videos are split into at most 4-minute segments, and later segments receive previous extraction results as text context so the annotator can preserve task continuity across segment boundaries.
The action spatial grounding stage compensates for the low visual resolution of long-context video inputs. For an action at timestamp \(t\), the system extracts frames at \(t-0.5s\), \(t\), and \(t+0.5s\), then predicts the action target from the low-level instruction and action type:
The first frame with a valid grounding result is kept. Manual verification of 200 sampled actions reports more than 95% correct parameterization. The action vocabulary is summarized in Table 3.
| Environment | Action groups | Parameter examples |
|---|---|---|
| Desktop | click, doubleClick, tripleClick, rightClick, middleClick, press, input, hotkey, scroll, drag, moveTo, wait, finished | x, y; [keys]; text; direction, x, y, distance; start, end |
| Mobile | click, longpress, scroll, pinch, input, drag, press, open, multi_touch, finished | x, y; x, y, duration; app_name; pointers; status |
Table 3. Desktop and mobile action space. The digest table condenses the source action-space table while preserving the action coverage used by trajectory annotation.
The model training recipe has two stages. Stage 1 continually pretrains Qwen2.5-VL and Mimo-VL for one epoch on WildGUI, about 200B tokens, with three complementary tasks: GUI grounding, GUI action prediction, and GUI trajectory modeling. The mixed objective is:
Stage 2 fine-tunes on curated open-source GUI datasets for three epochs, about 15B tokens, to align the broad pretraining behavior with cleaner supervised instruction-following data.
The appendix also defines the training losses for the filter models. The metadata classifier uses binary cross-entropy:
The video scorer uses mean squared error over the three quality dimensions:
Method Details
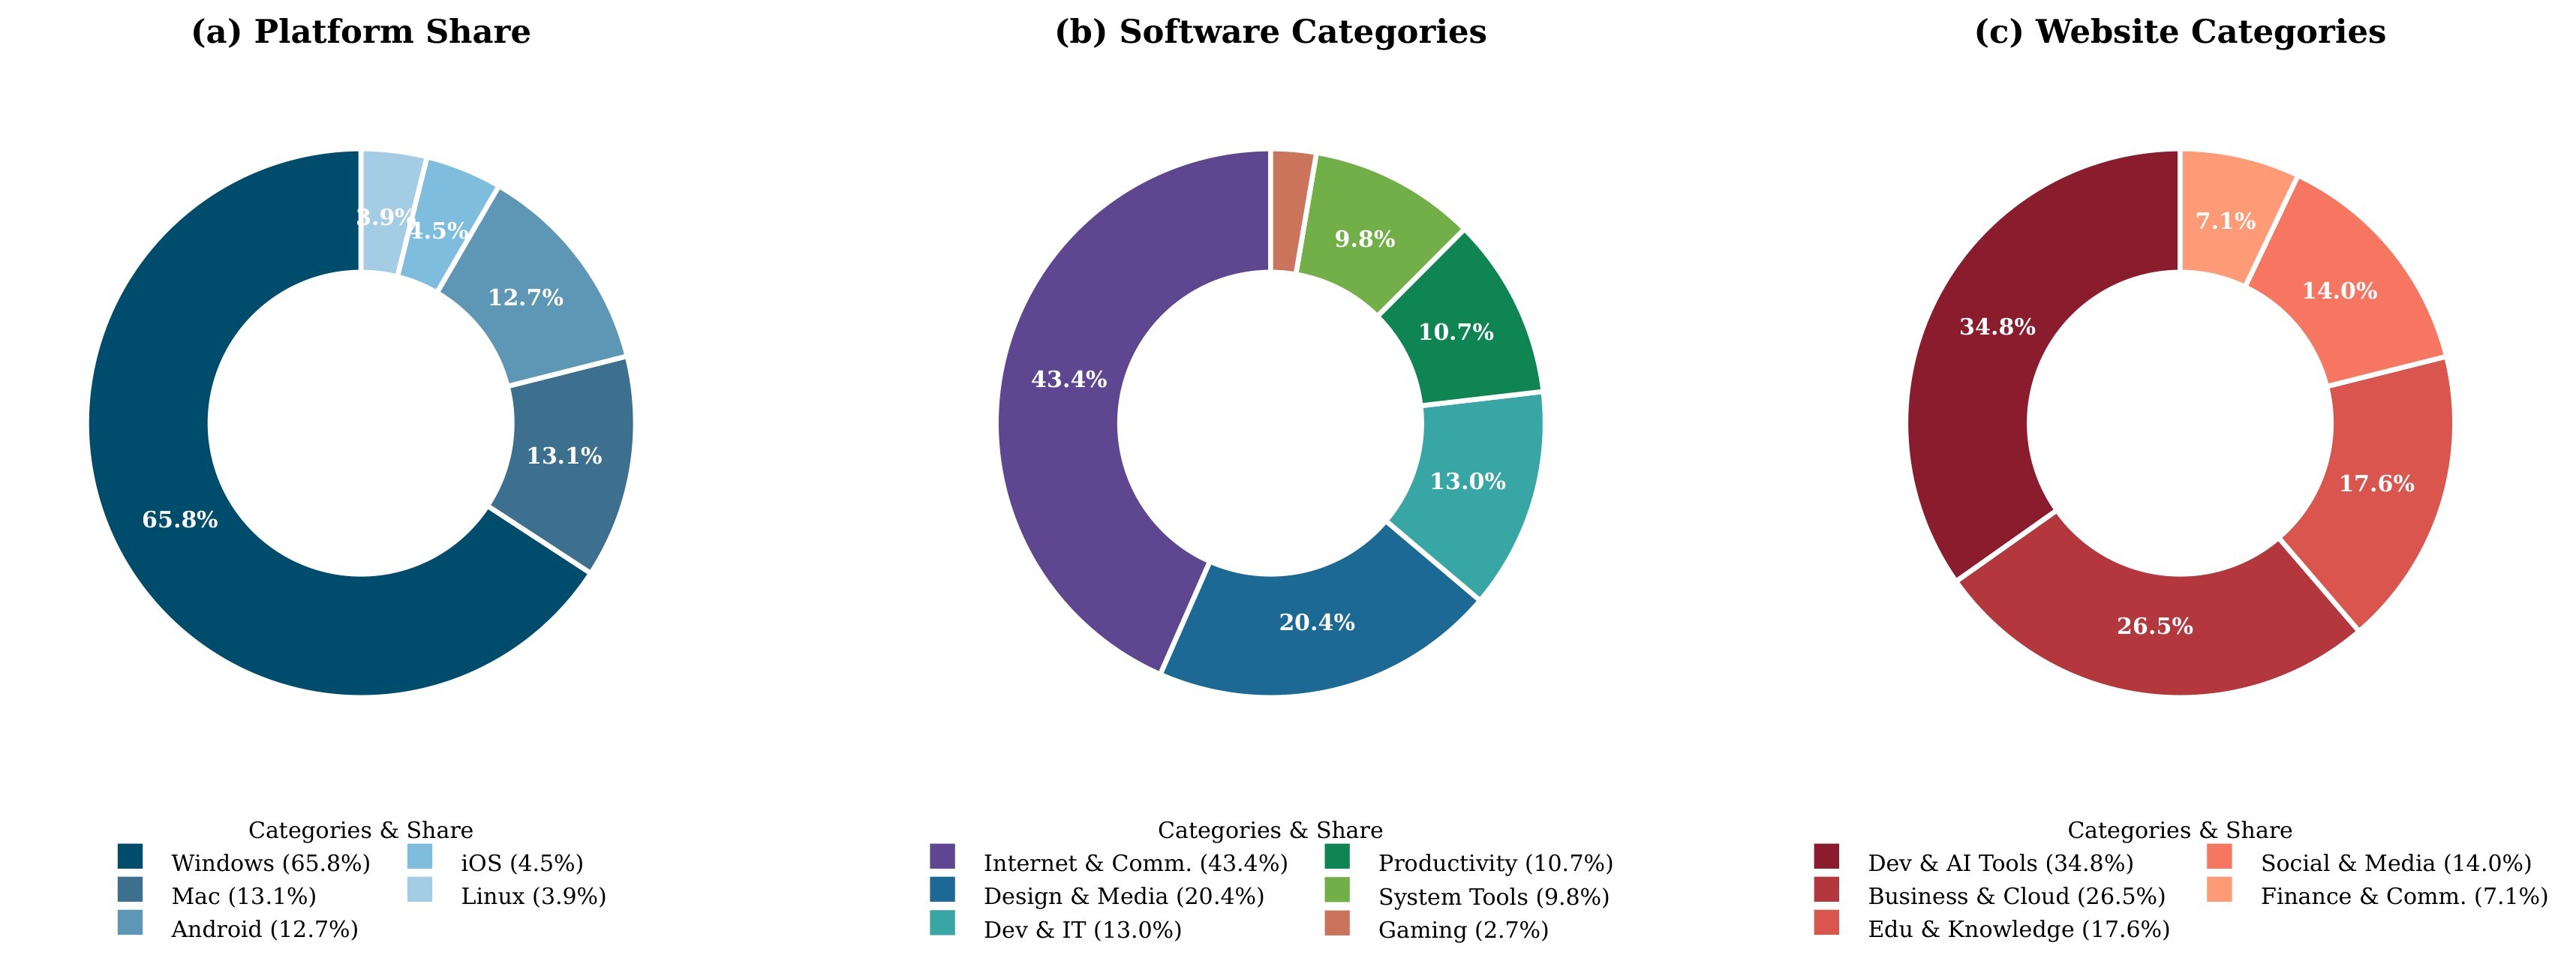
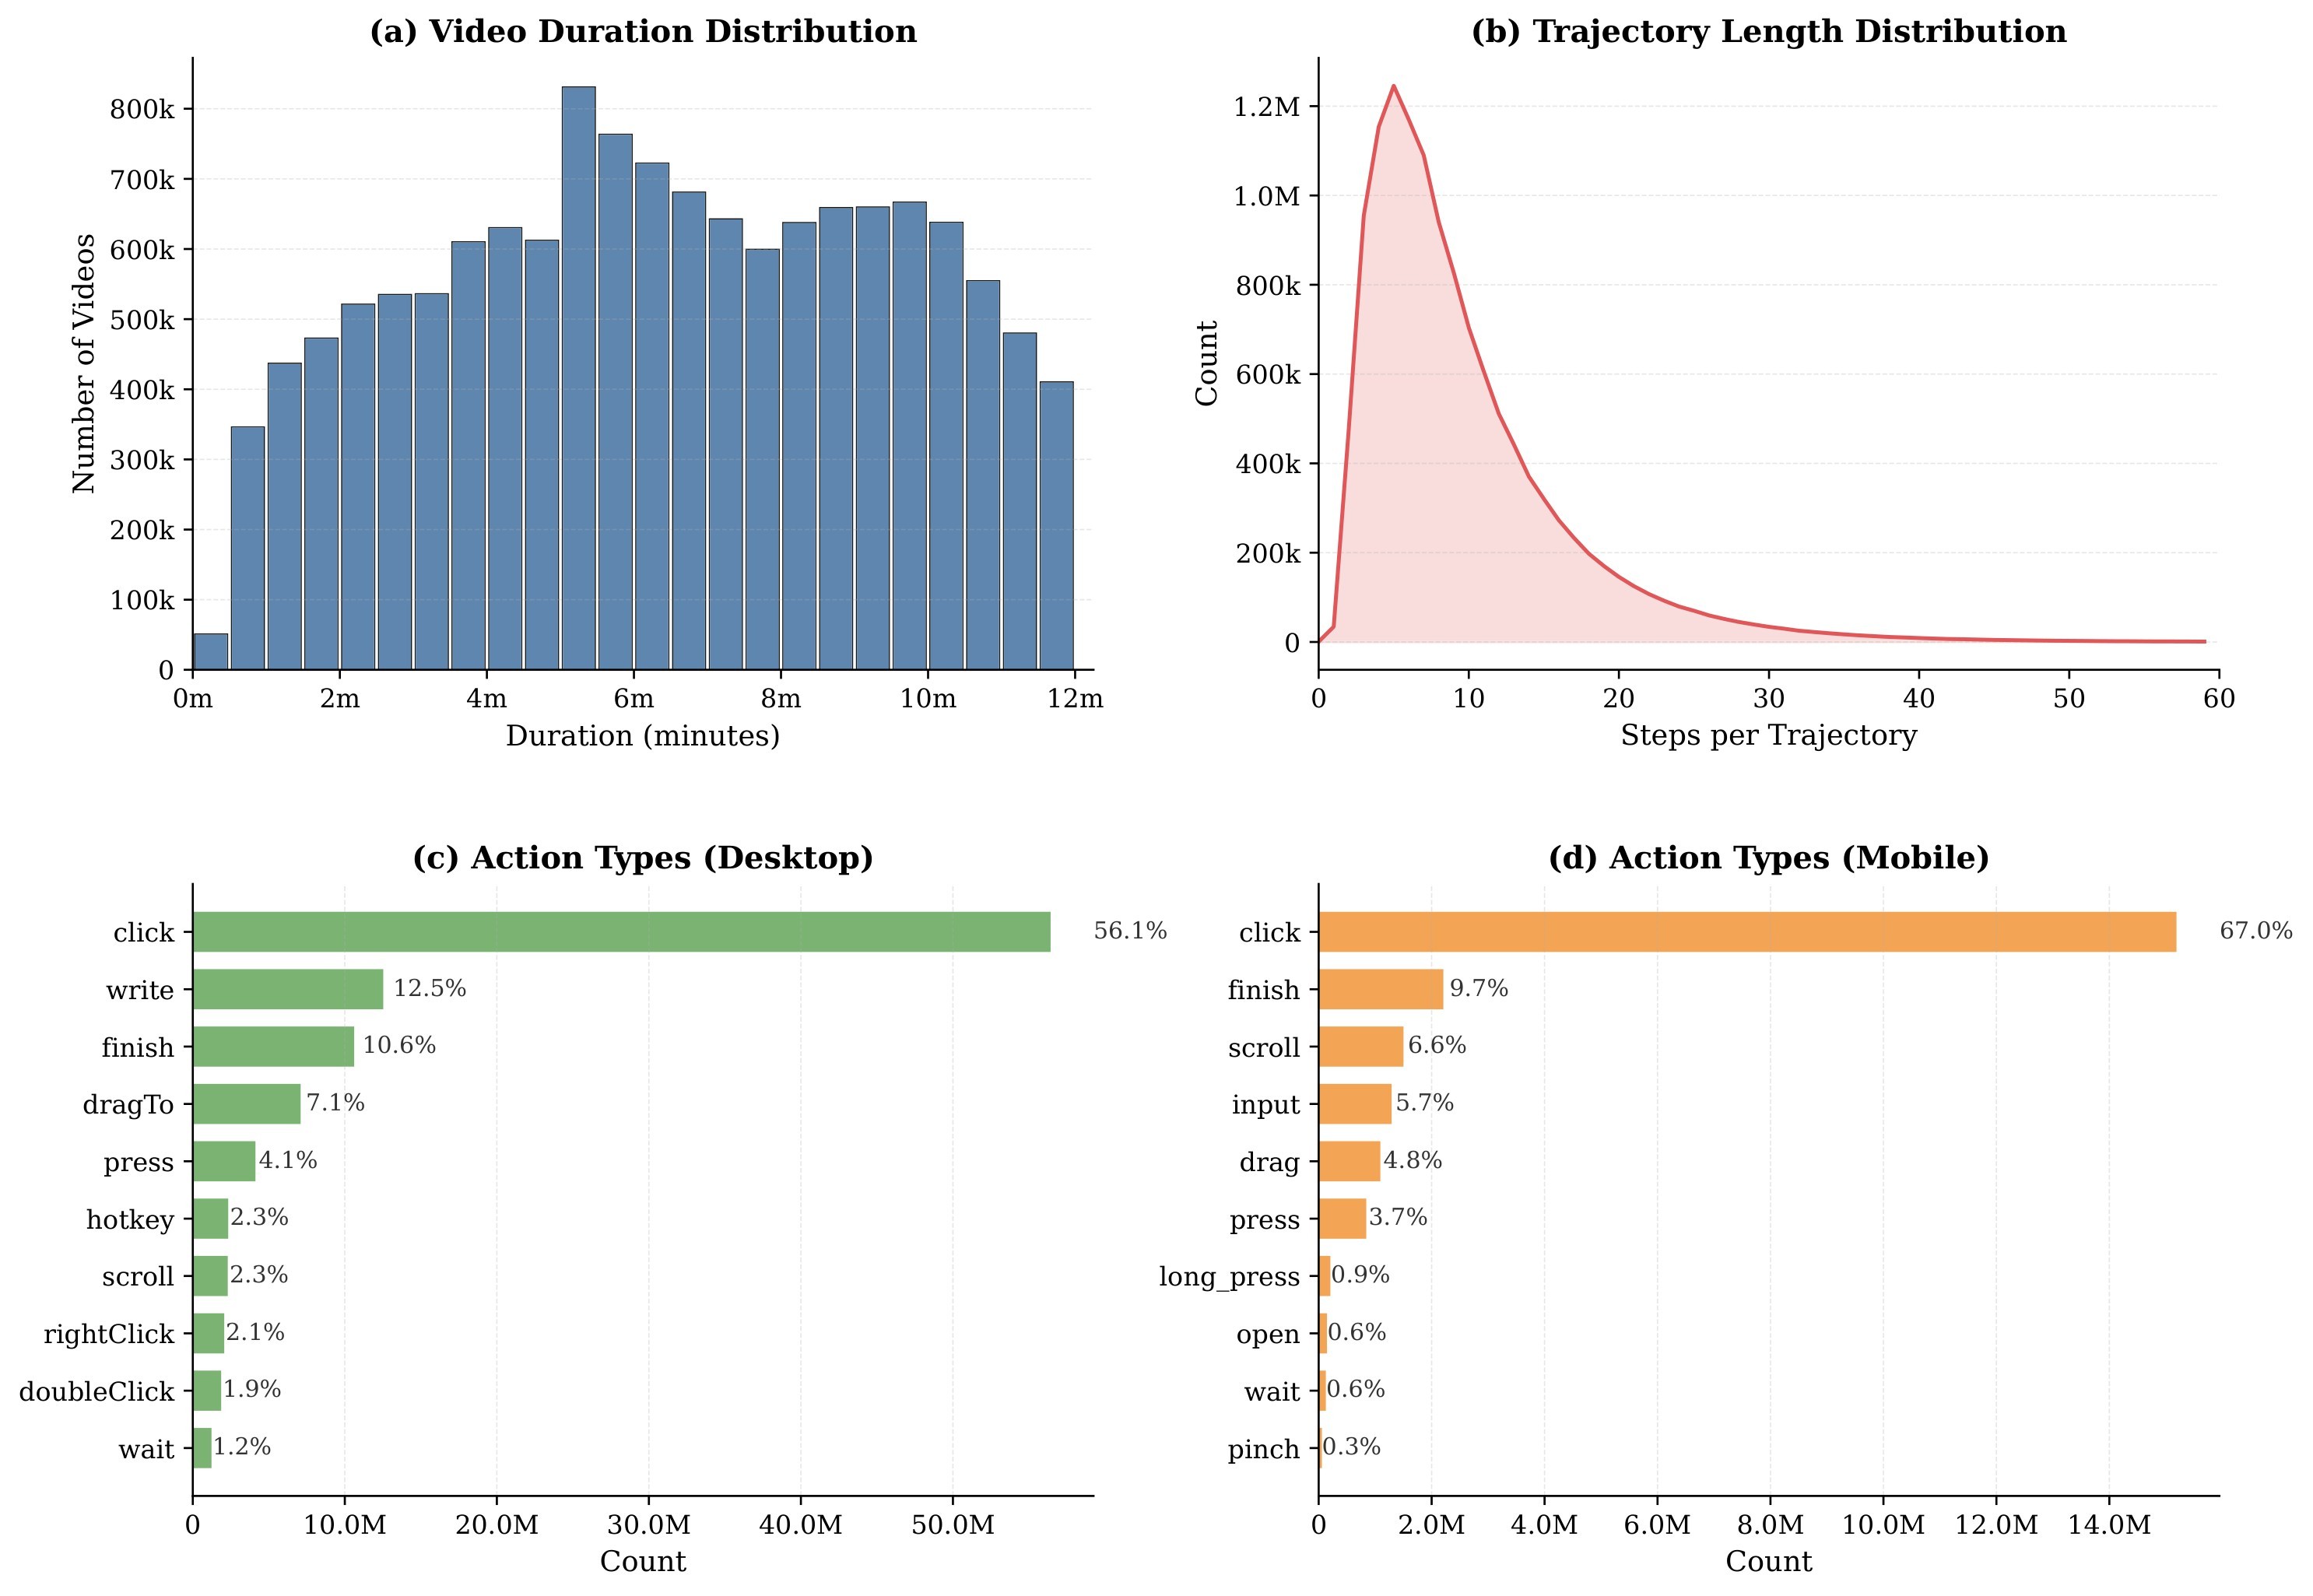
WildGUI is positioned as a pretraining-scale dataset rather than a benchmark. It is built from 500M+ metadata entries, 20M filtered candidates, 4.16M retained videos, and about 300K hours of source tutorial content. The final source dataset contains 12.7M GUI operation trajectories, 124.5M screenshots, over 1,500 environments, and a 9.7-turn average. The distribution plots in Figure 6 and Figure 7 show why this matters: the dataset is intended to cover platforms, software categories, web categories, video durations, trajectory lengths, and action types rather than a single app family.
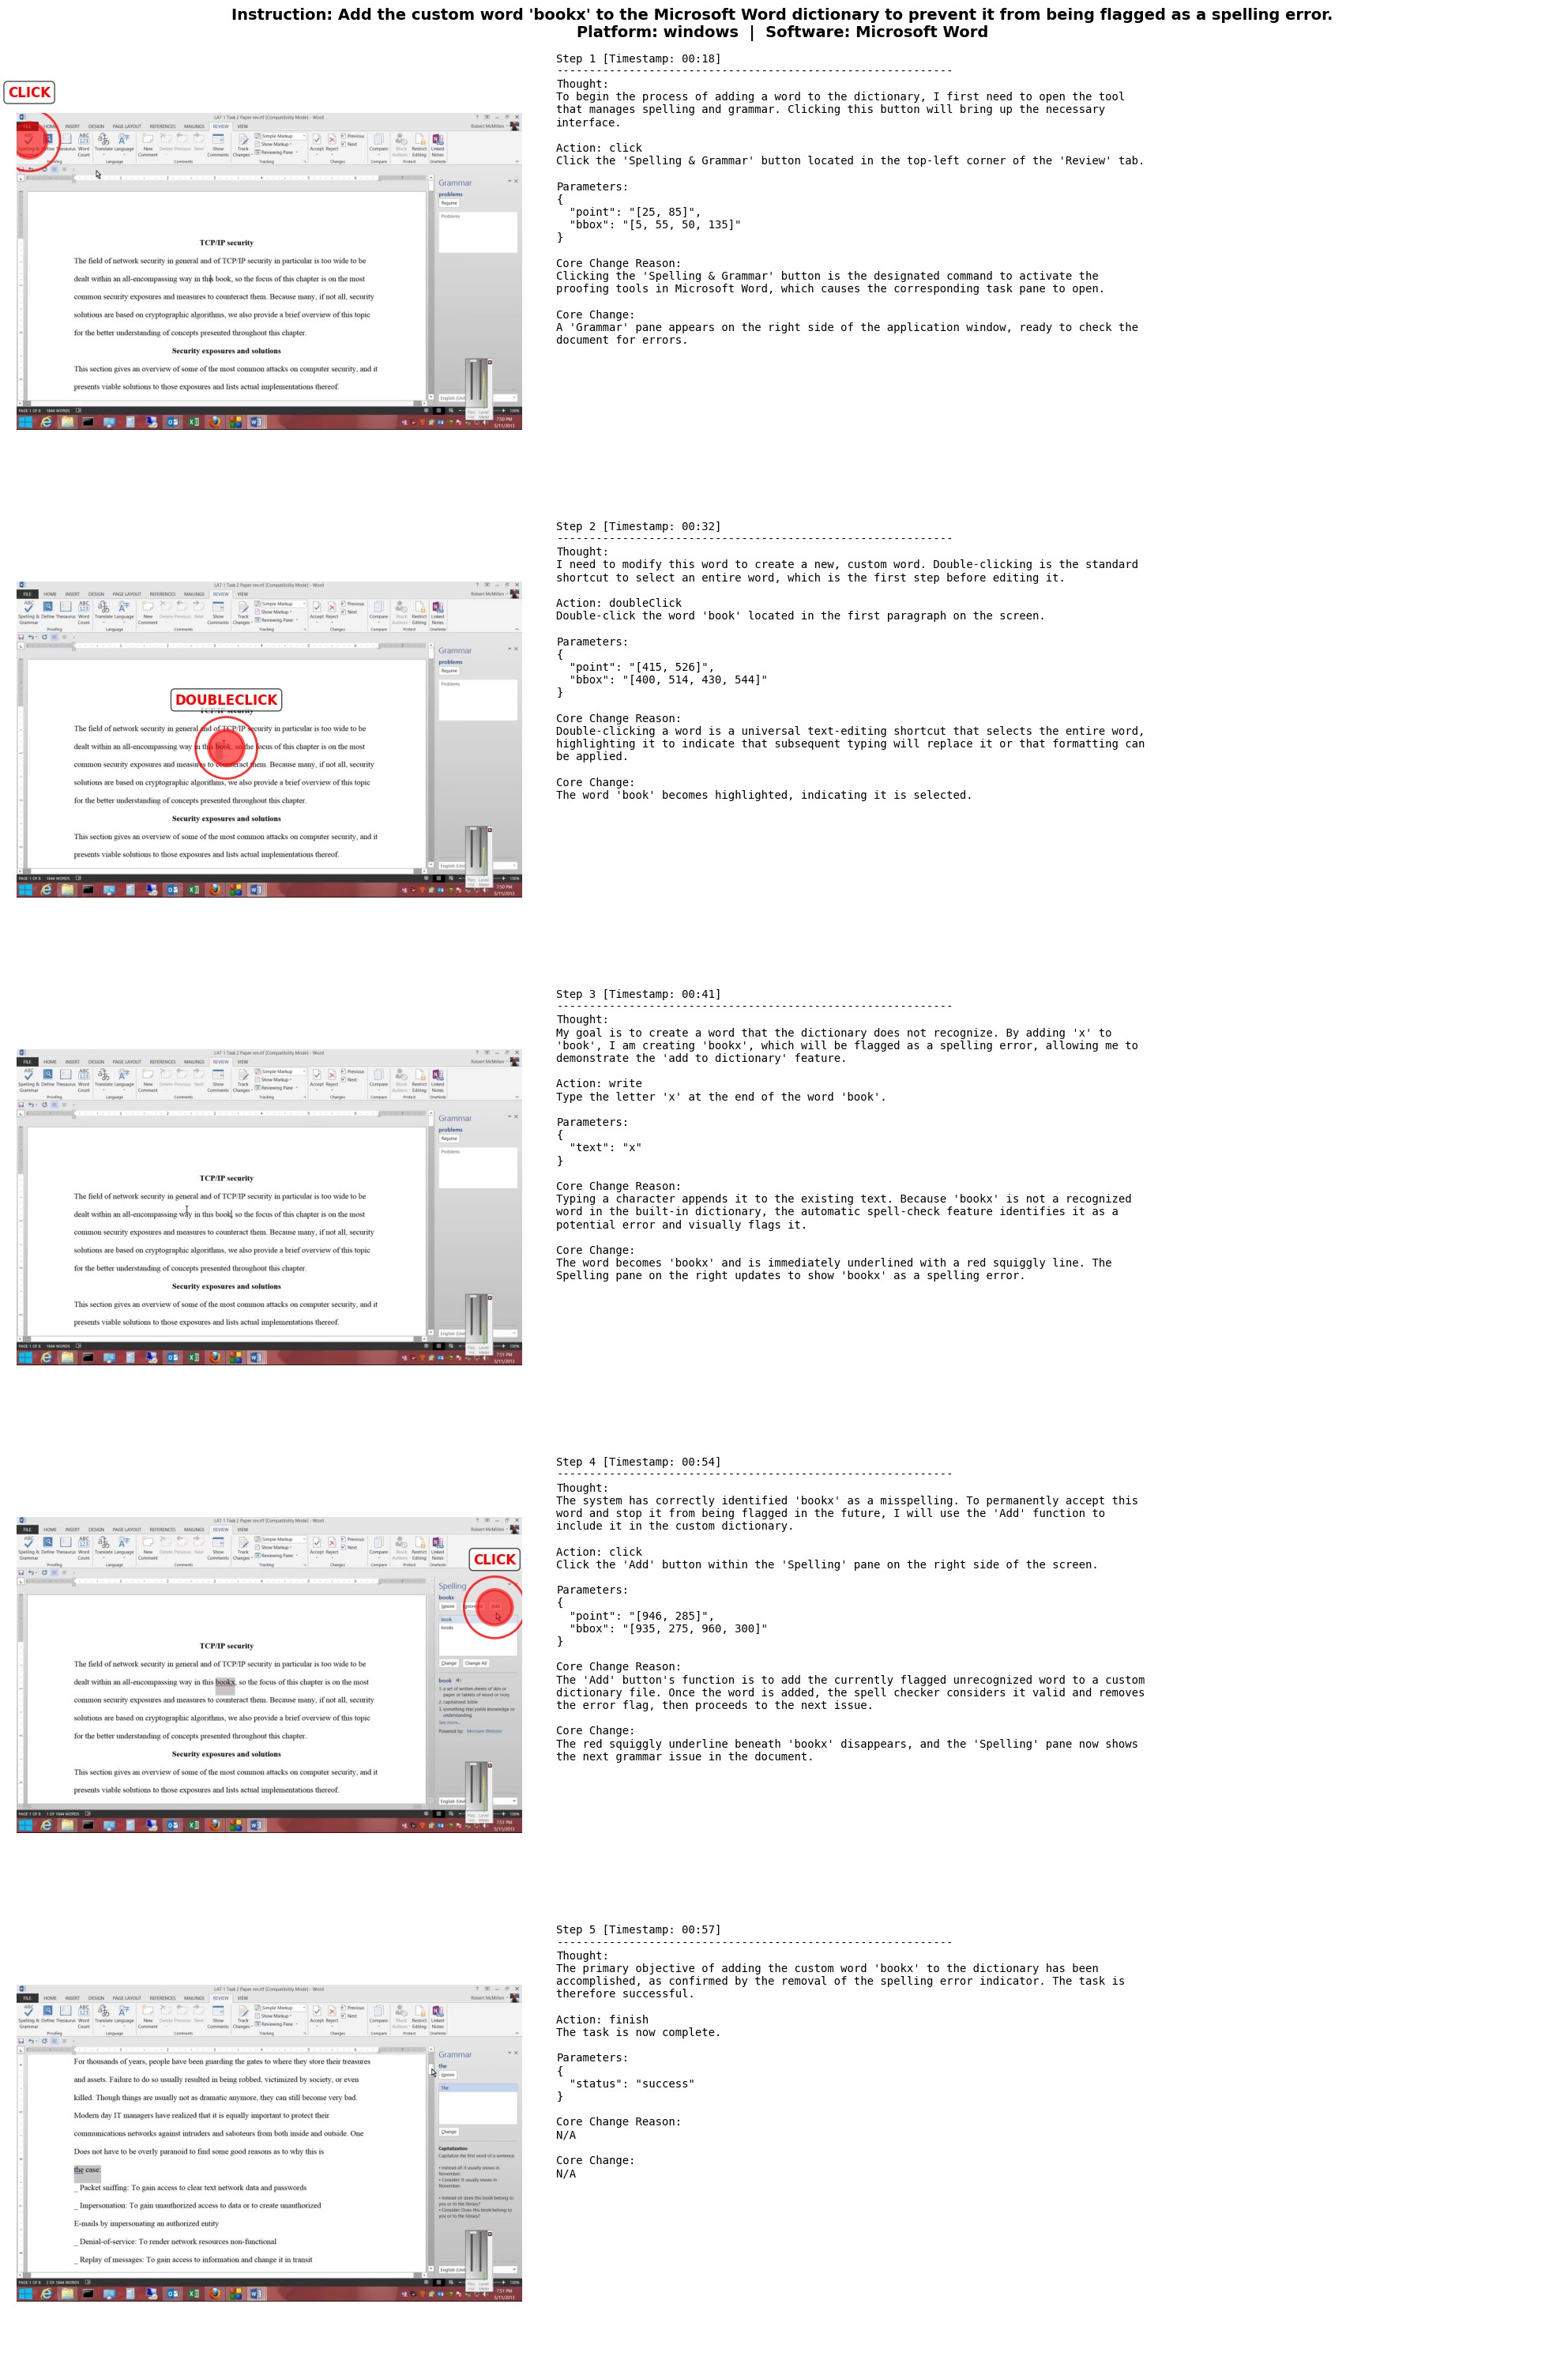
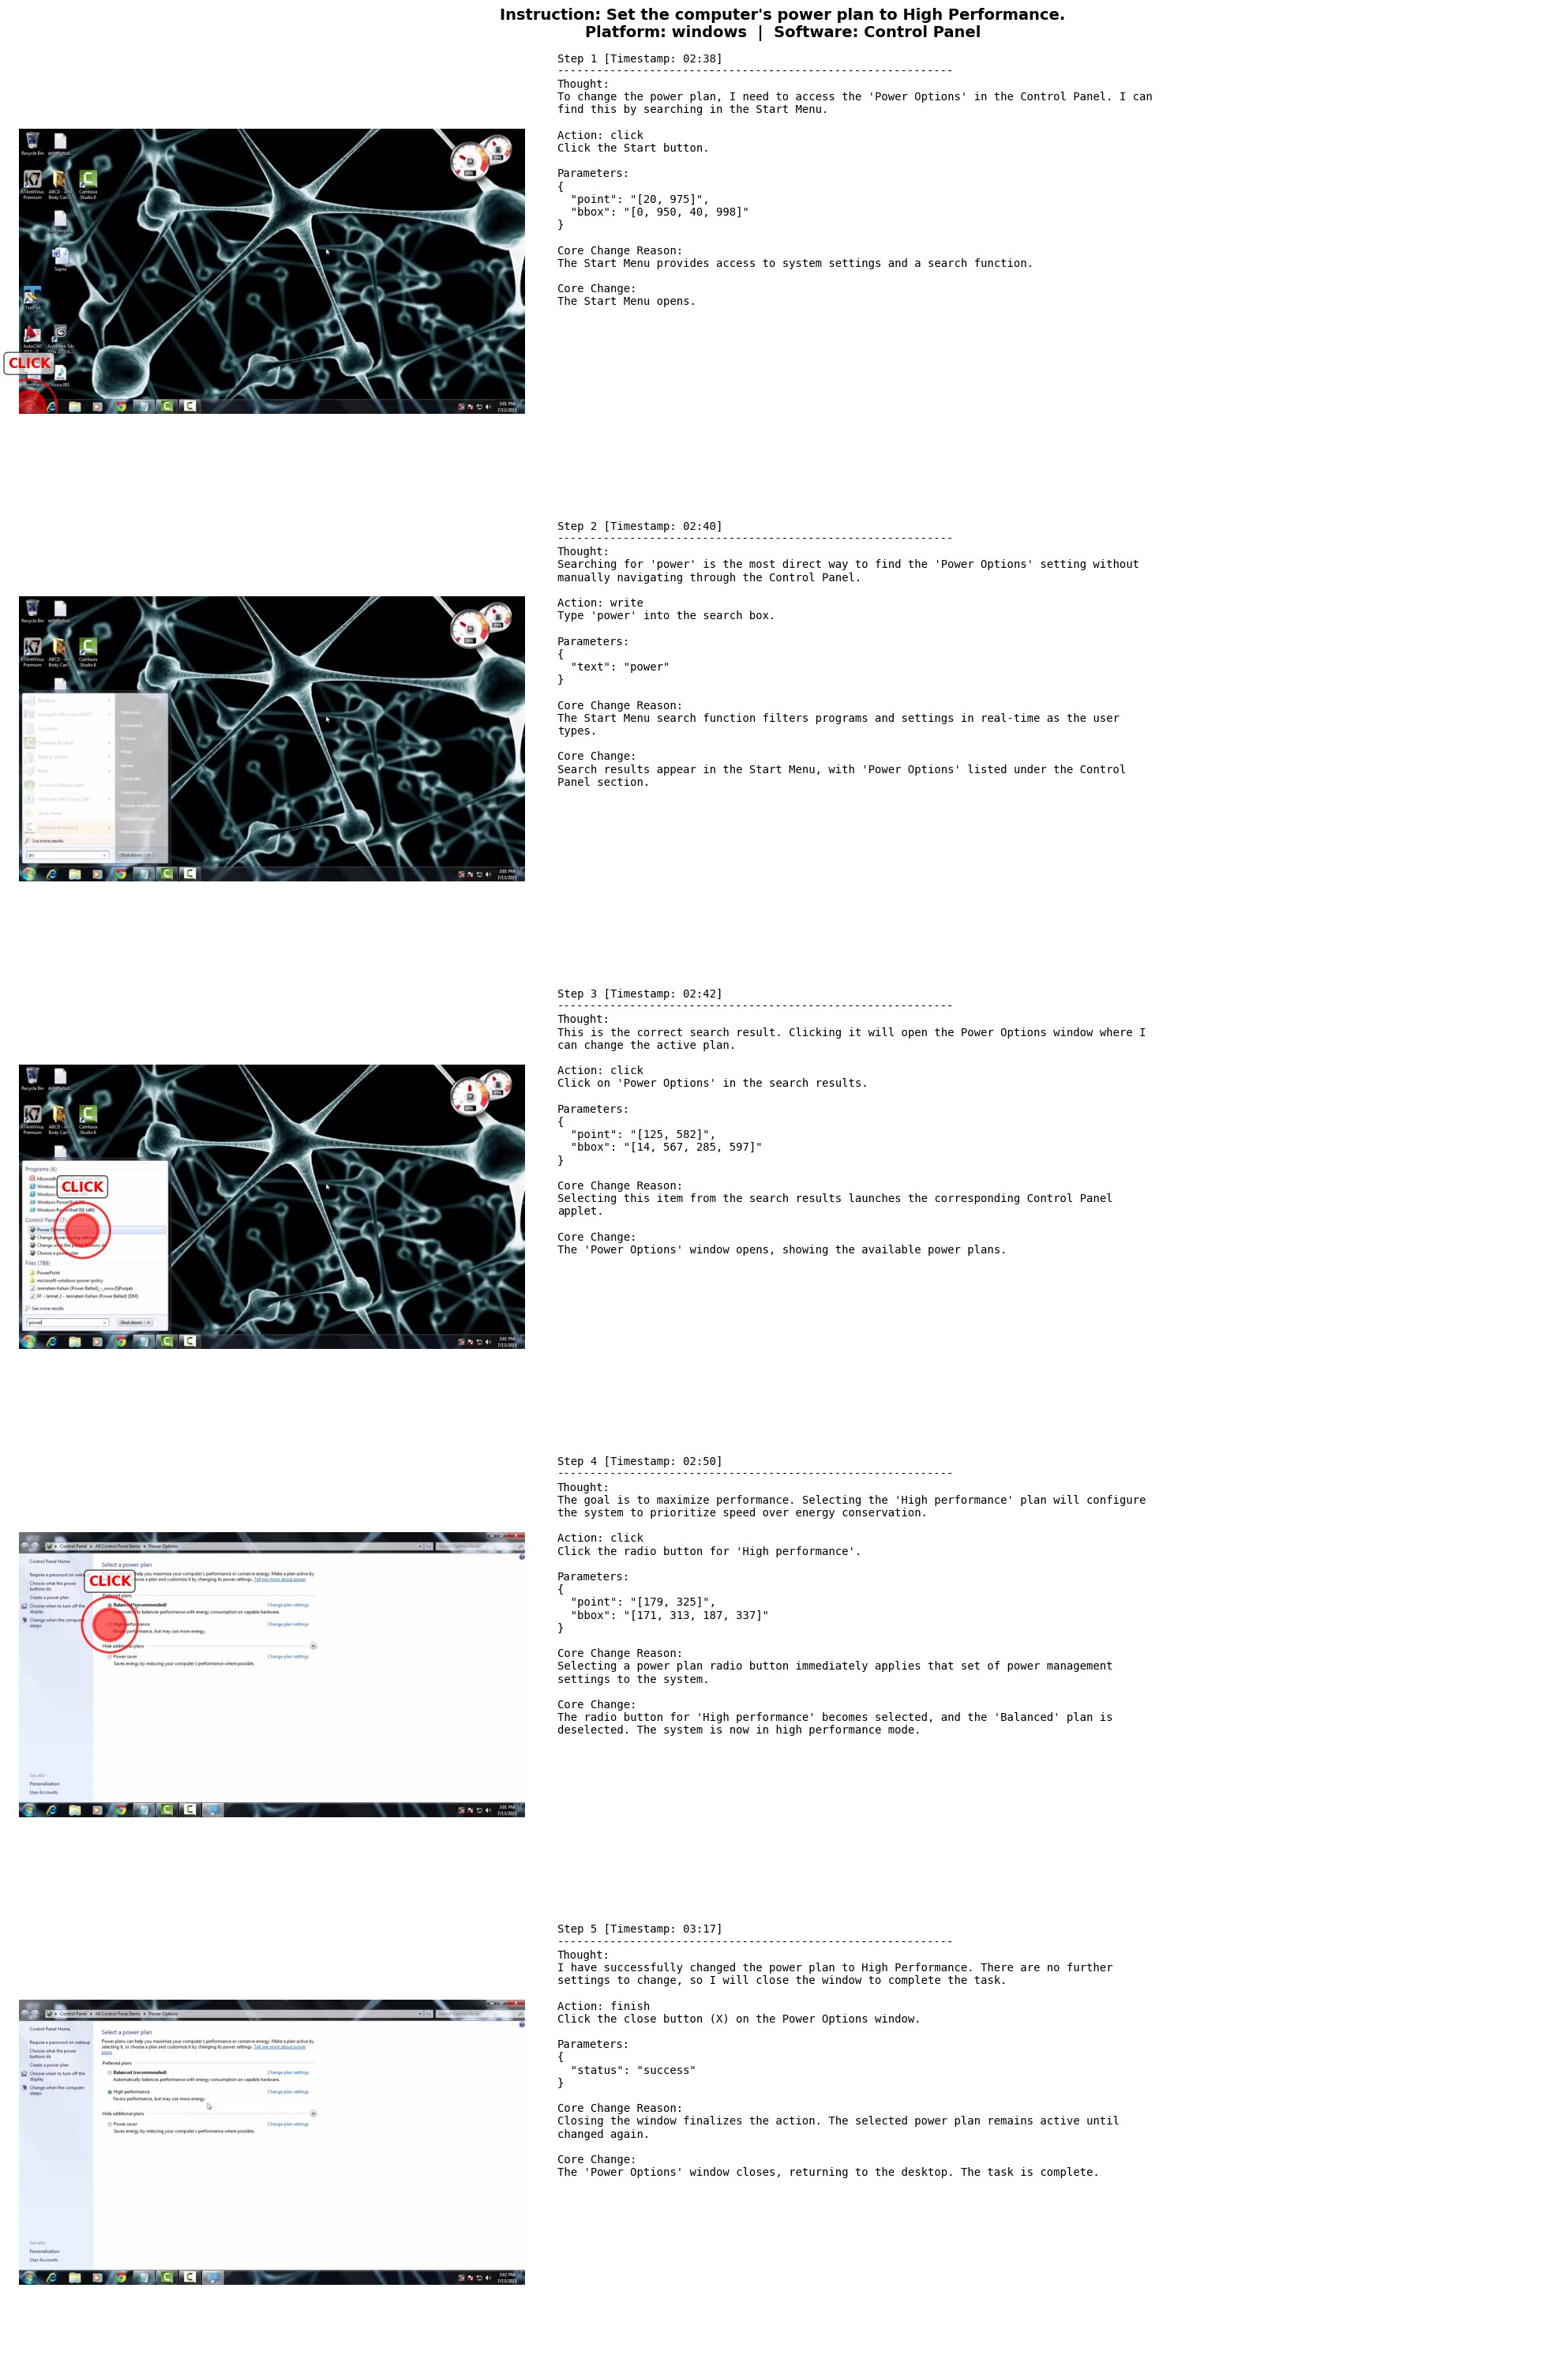
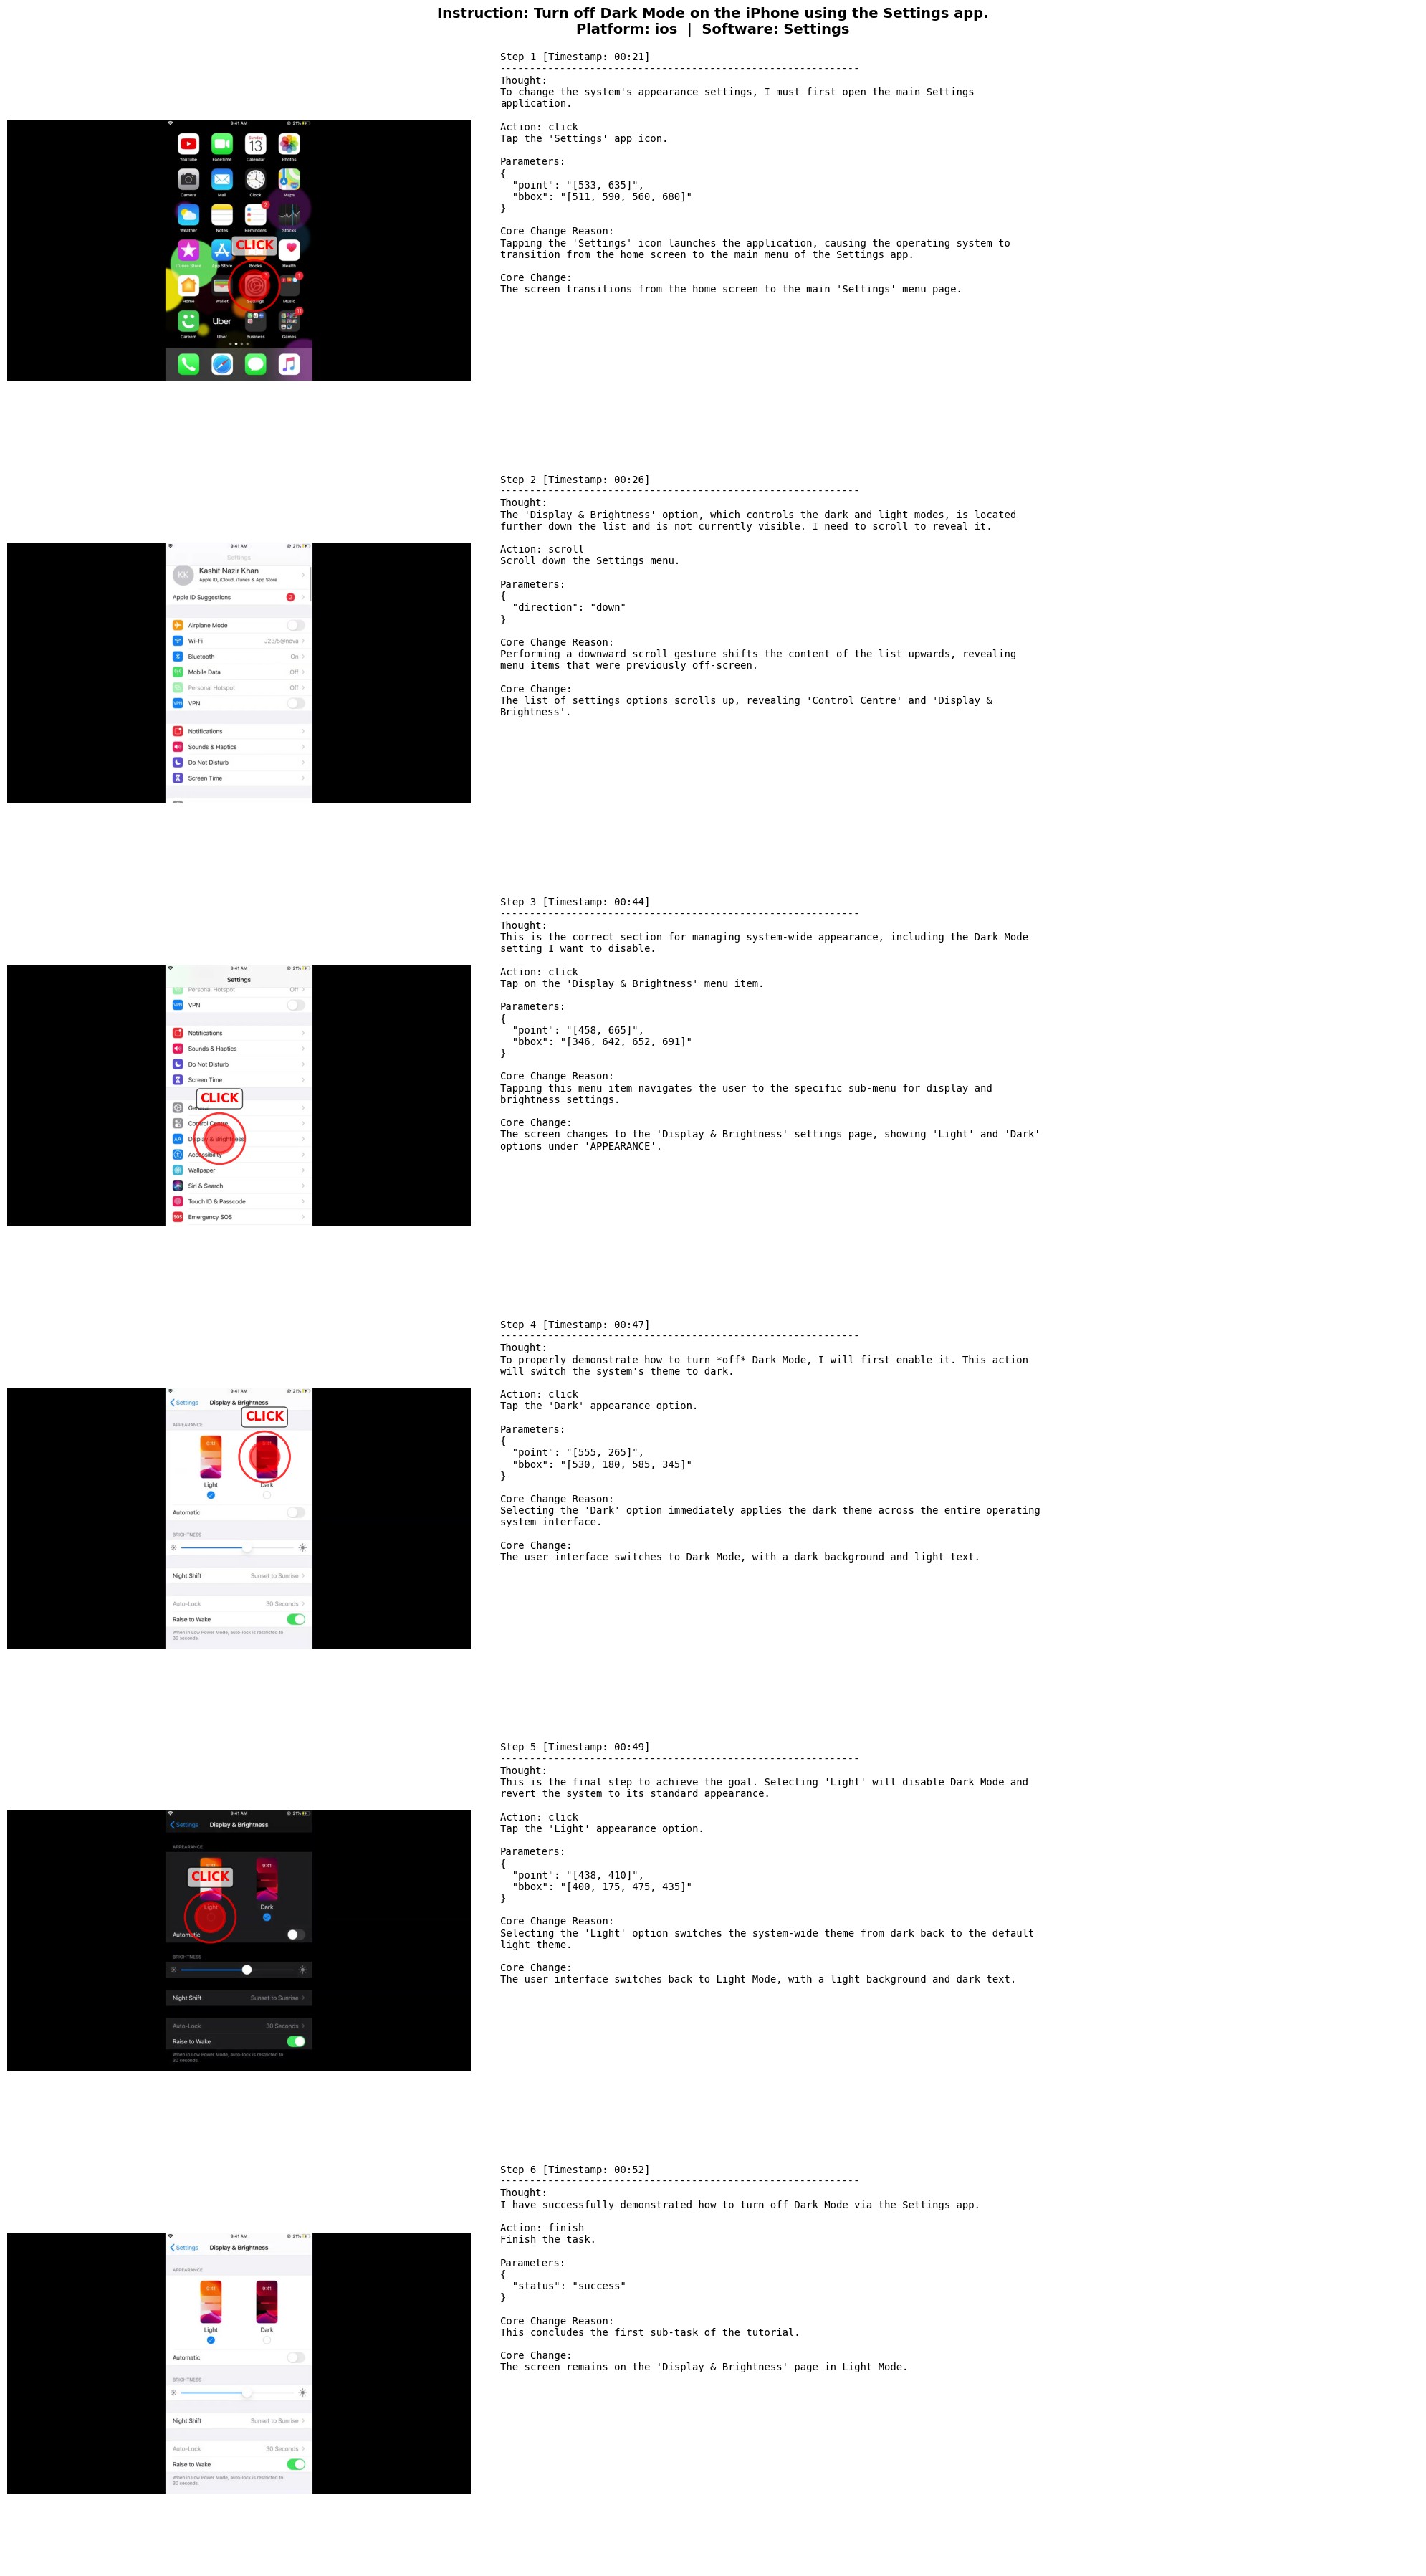
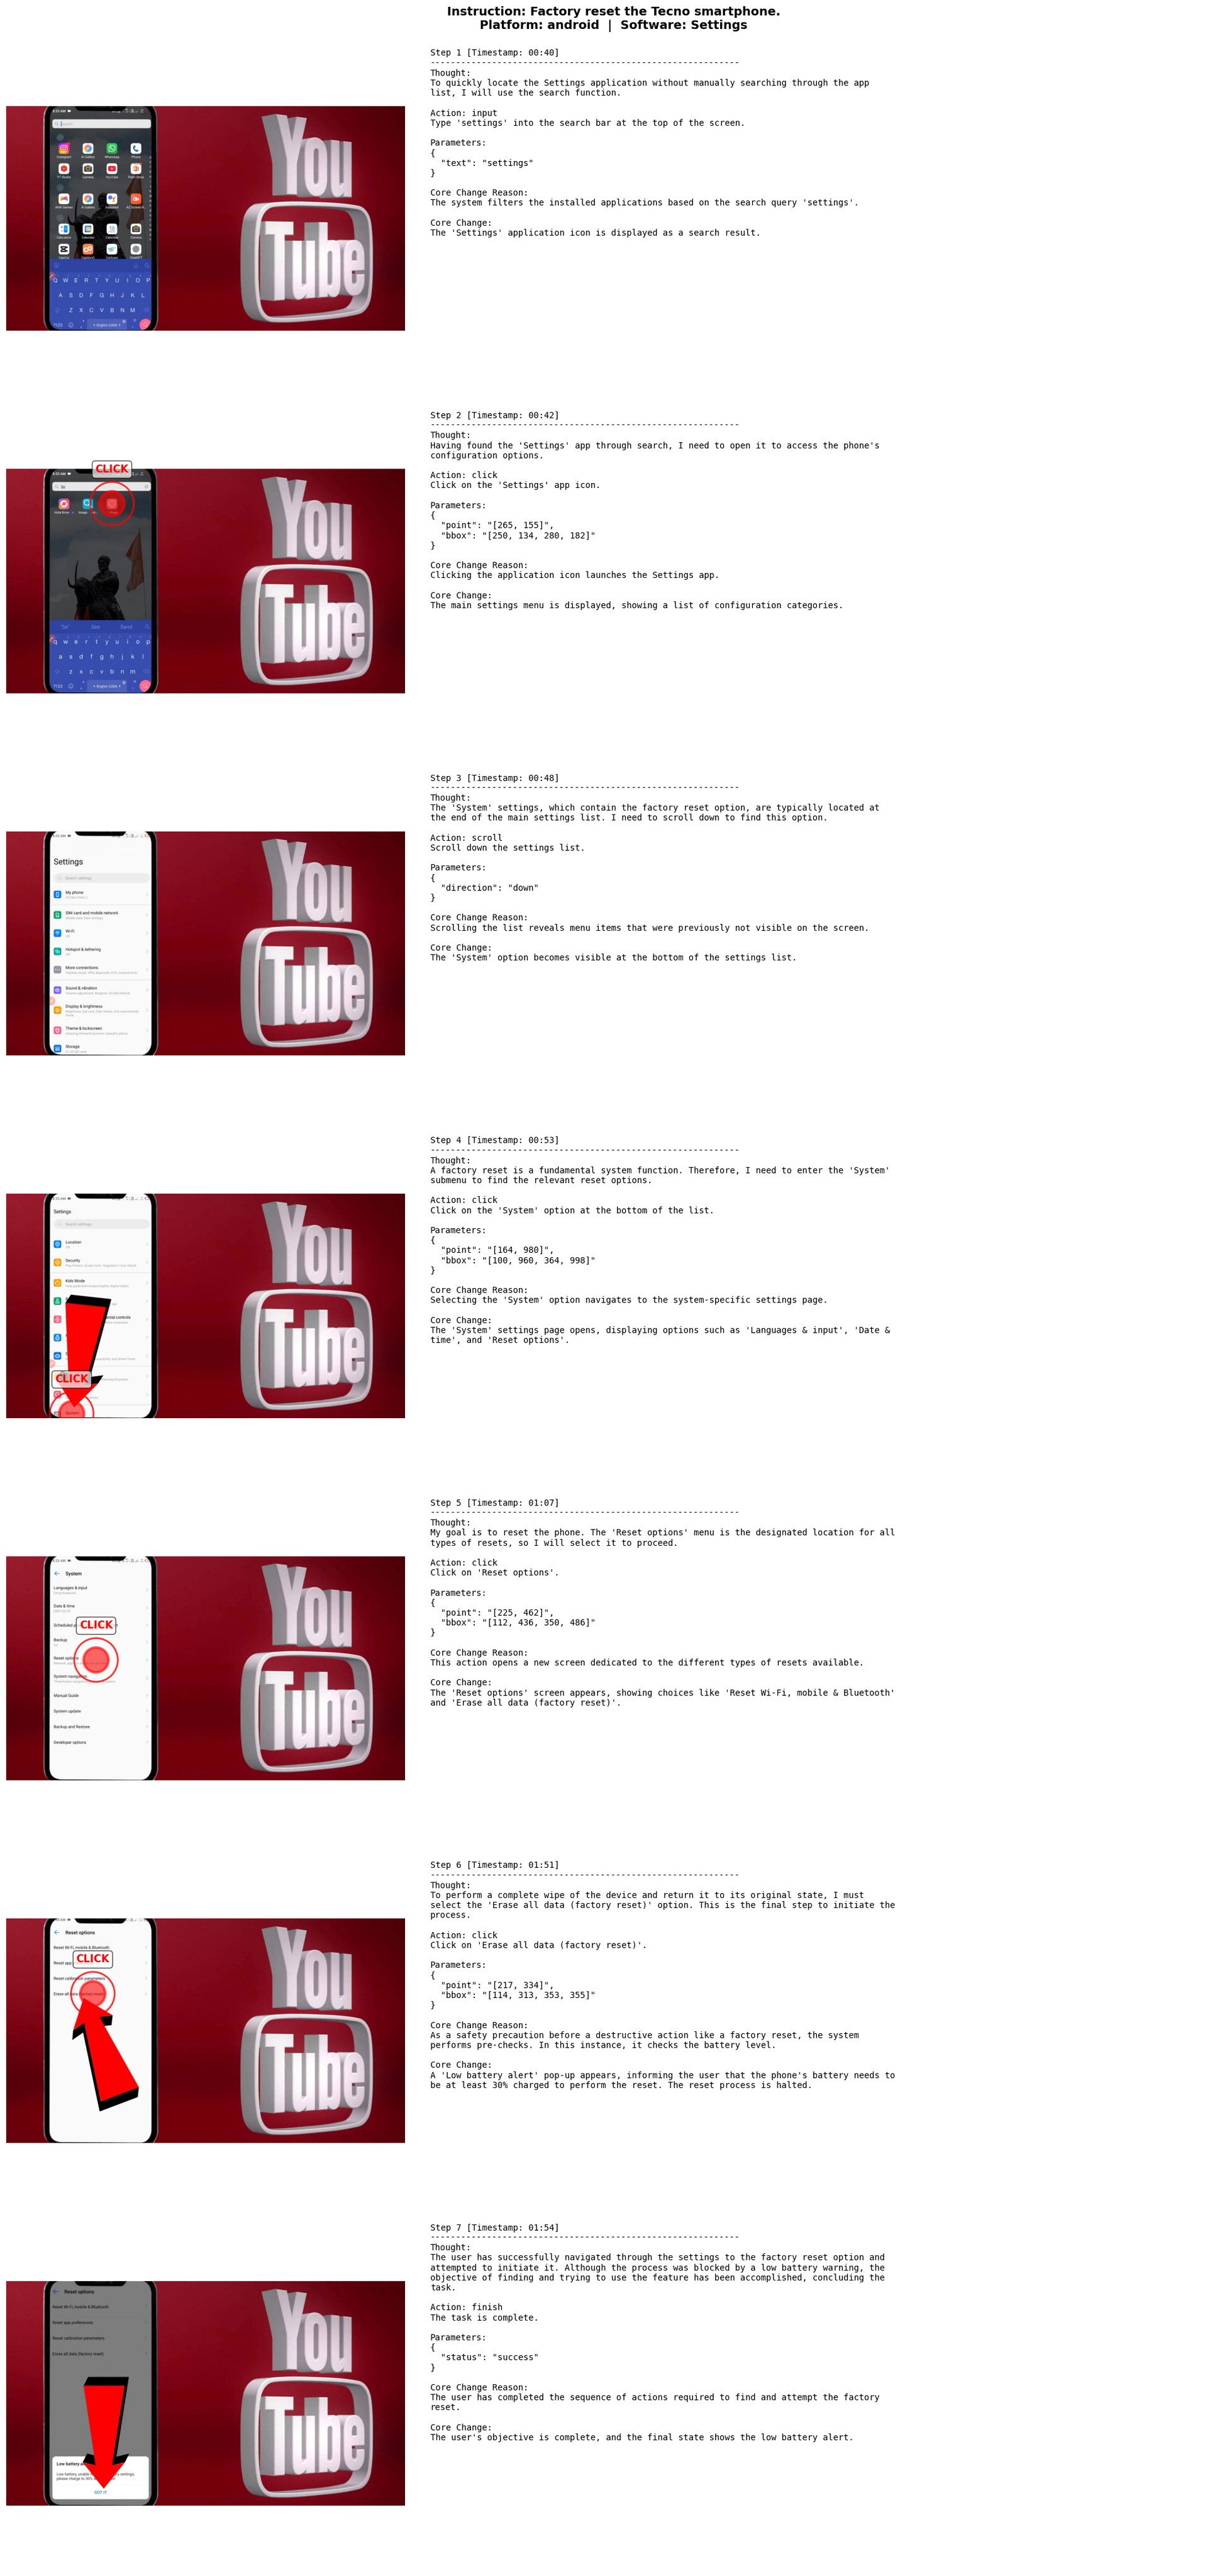
The paper's extraction prompts ask for more than raw action labels. Each segment annotation includes user task instruction, dense caption, task plan, platform, application type, website name, and action trajectory. Each action stores timestamp, action type, low-level grounding instruction, action rationale, action parameters, and the expected interface change. That design is meant to train not only point-and-click behavior but also a rudimentary GUI world model.
The examples in Figure 8, Figure 9, Figure 10, and Figure 11 show source WildGUI trajectory records rather than downstream benchmark outputs.
Experiments And Results
The authors evaluate three capabilities: GUI grounding, offline mobile/CN GUI-agent execution, and online interaction in OSWorld and AndroidWorld. The grounding results in Table 4 are the cleanest evidence that WildGUI helps both base architectures. Qwen2.5-VL-7B improves from 26.8 to 41.9 on ScreenSpot-Pro average and from 27.3 to 53.7 on OSWorld-G average. Mimo-VL-7B improves from 41.2 to 56.9 on ScreenSpot-Pro average and from 54.7 to 67.6 on OSWorld-G average, exceeding Qwen3-VL-32B on OSWorld-G average and matching or surpassing most open-source grounding baselines.
| Model | ScreenSpot-Pro Avg | OSWorld-G Avg | Notes |
|---|---|---|---|
| Seed1.5-VL | 60.9 | 62.9 | Proprietary baseline |
| Qwen3-VL-32B | 54.9 | 60.6 | Open-source baseline evaluated by authors |
| Qwen2.5-VL-7B | 26.8 | 27.3 | Base model |
| Qwen2.5-VL-7B + WildGUI | 41.9 | 53.7 | +15.1 ScreenSpot-Pro, +26.4 OSWorld-G |
| Mimo-VL-7B | 41.2 | 54.7 | Base model |
| Mimo-VL-7B + WildGUI | 56.9 | 67.6 | +15.7 ScreenSpot-Pro, +12.9 OSWorld-G |
Table 4. GUI grounding results. Compact transcription of the source ScreenSpot-Pro and OSWorld-G table, retaining the headline averages and gains.
The offline agent results in Table 5 show smaller but consistent gains. Mimo-VL-7B + WildGUI reaches 91.8 step success on AndroidControl-Low, 71.4 on AndroidControl-High, and 71.0 on CAGUI, all above the corresponding base model. Qwen2.5-VL also improves, especially on CAGUI.
| Model | AndroidControl-Low Step SR | AndroidControl-High Step SR | CAGUI Type Acc. | CAGUI Step SR |
|---|---|---|---|---|
| Qwen2.5-VL-7B | 85.0 | 62.9 | 74.2 | 55.2 |
| Qwen2.5-VL-7B + WildGUI | 90.3 | 64.5 | 88.3 | 65.4 |
| Mimo-VL-7B | 87.9 | 65.6 | 82.2 | 63.4 |
| Mimo-VL-7B + WildGUI | 91.8 | 71.4 | 90.3 | 71.0 |
Table 5. Offline GUI-agent results. The table keeps the reported step-success and CAGUI metrics most relevant to agent execution.
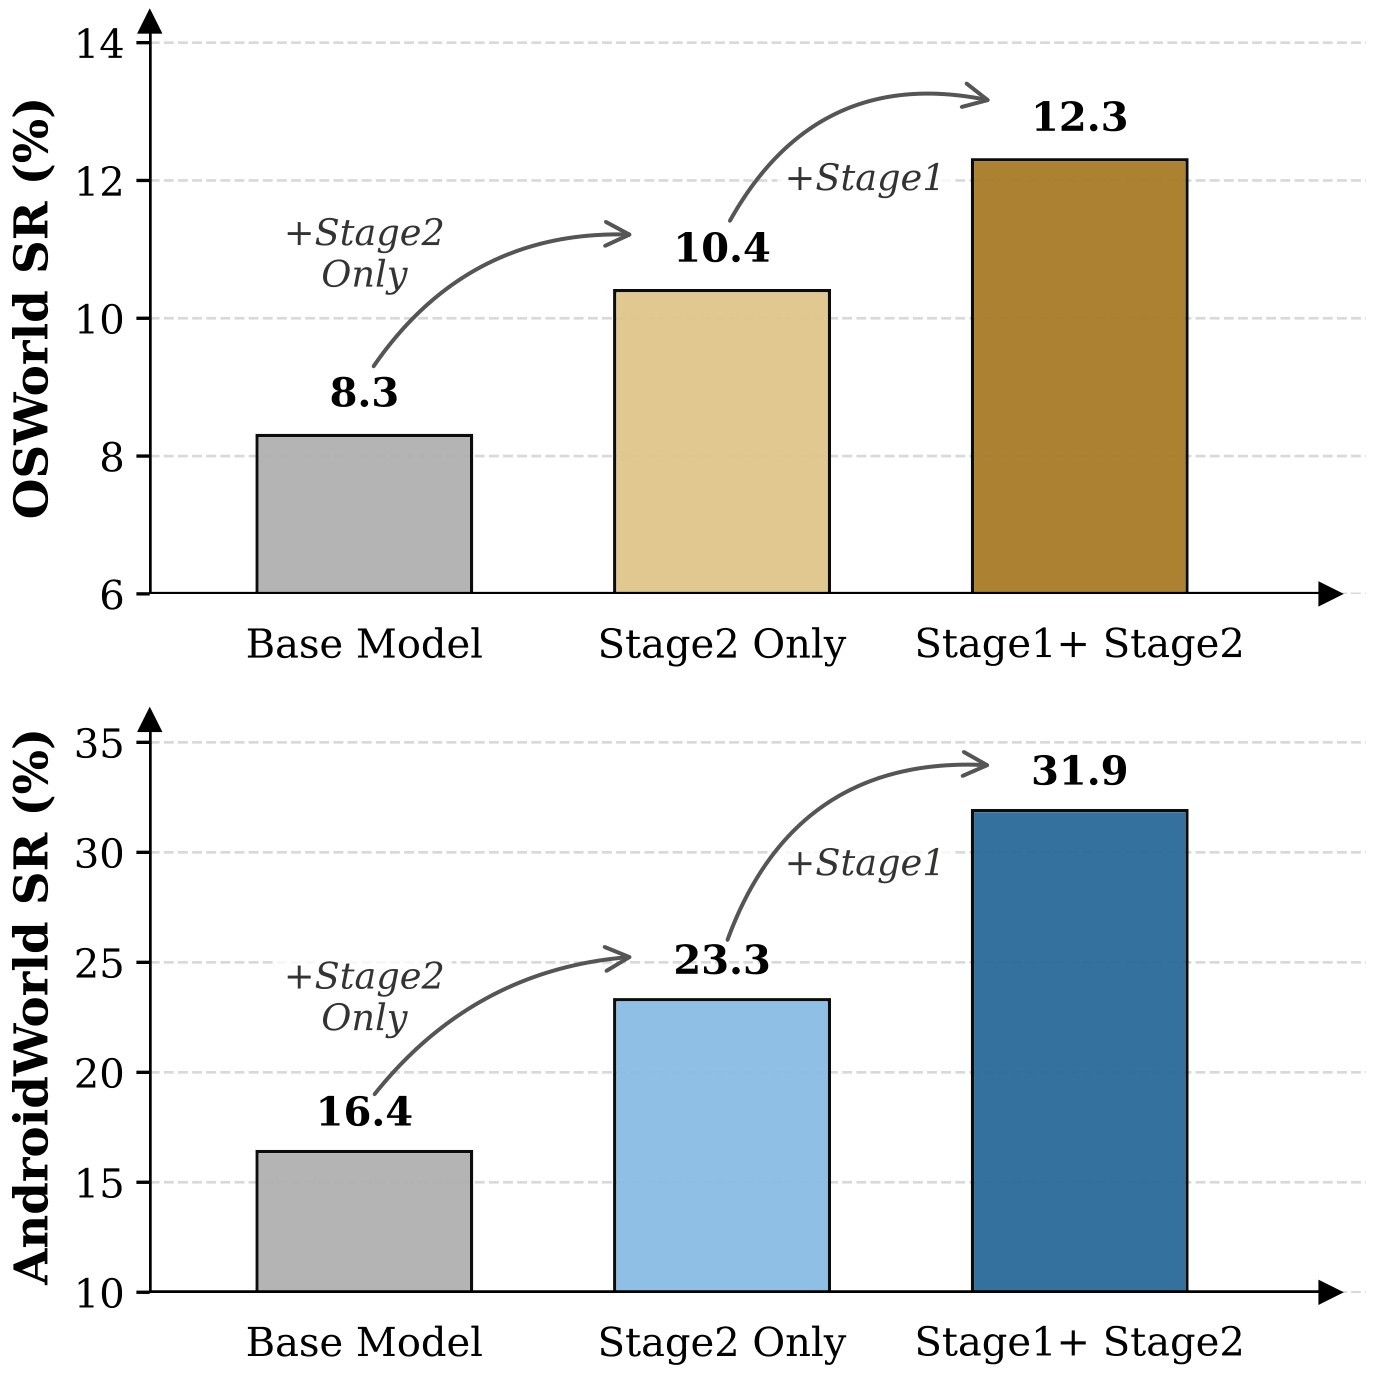
For online evaluation, Figure 2 supports the key generalization claim. Mimo-VL-7B with Stage 1 WildGUI pretraining plus Stage 2 post-training reaches 31.9% on AndroidWorld, compared with 16.4% for the base model and 23.3% for Stage 2 only. On OSWorld it reaches 12.3%, compared with 10.4% for Stage 2 only. These absolute numbers are still modest, but the relative improvement suggests offline video-derived data can transfer to live dynamic environments.
The scaling study in Figure 3 varies pretraining from 0 to 200B tokens and compares against a Stage 2 only baseline. ScreenSpot-Pro rises from about 41% to 56.9%, and OSWorld-G rises from about 55% to 67.6%. The authors report no evident saturation in this range and note that OSWorld-G surpasses Stage 2 only around 50B tokens.
The ablation in Table 6 clarifies what the model is using. Removing \(\mathcal{L}_{\text{ground}}\) hurts ScreenSpot-Pro most, dropping 56.9 to 49.8. Removing \(\mathcal{L}_{\text{traj}}\) preserves static metrics better but drops AndroidWorld from 31.9 to 24.1, consistent with the claim that trajectory modeling matters for long-horizon online execution. Removing Stage 2 is catastrophic, dropping AndroidWorld to 6.0, so WildGUI pretraining is not a replacement for alignment-style supervised post-training.
| Setting | ScreenSpot-Pro | CAGUI | AndroidWorld |
|---|---|---|---|
| Ours | 56.9 | 71.0 | 31.9 |
| w/o \(\mathcal{L}_{\text{ground}}\) | 49.8 | 69.8 | 28.4 |
| w/o \(\mathcal{L}_{\text{action}}\) | 50.5 | 65.3 | 27.6 |
| w/o \(\mathcal{L}_{\text{traj}}\) | 54.6 | 70.2 | 24.1 |
| w/o Stage 1 | 49.3 | 64.2 | 23.3 |
| w/o Stage 2 | 28.2 | 45.7 | 6.0 |
Table 6. Training-objective and stage ablation. The table is copied from the source ablation and normalized to Markdown.
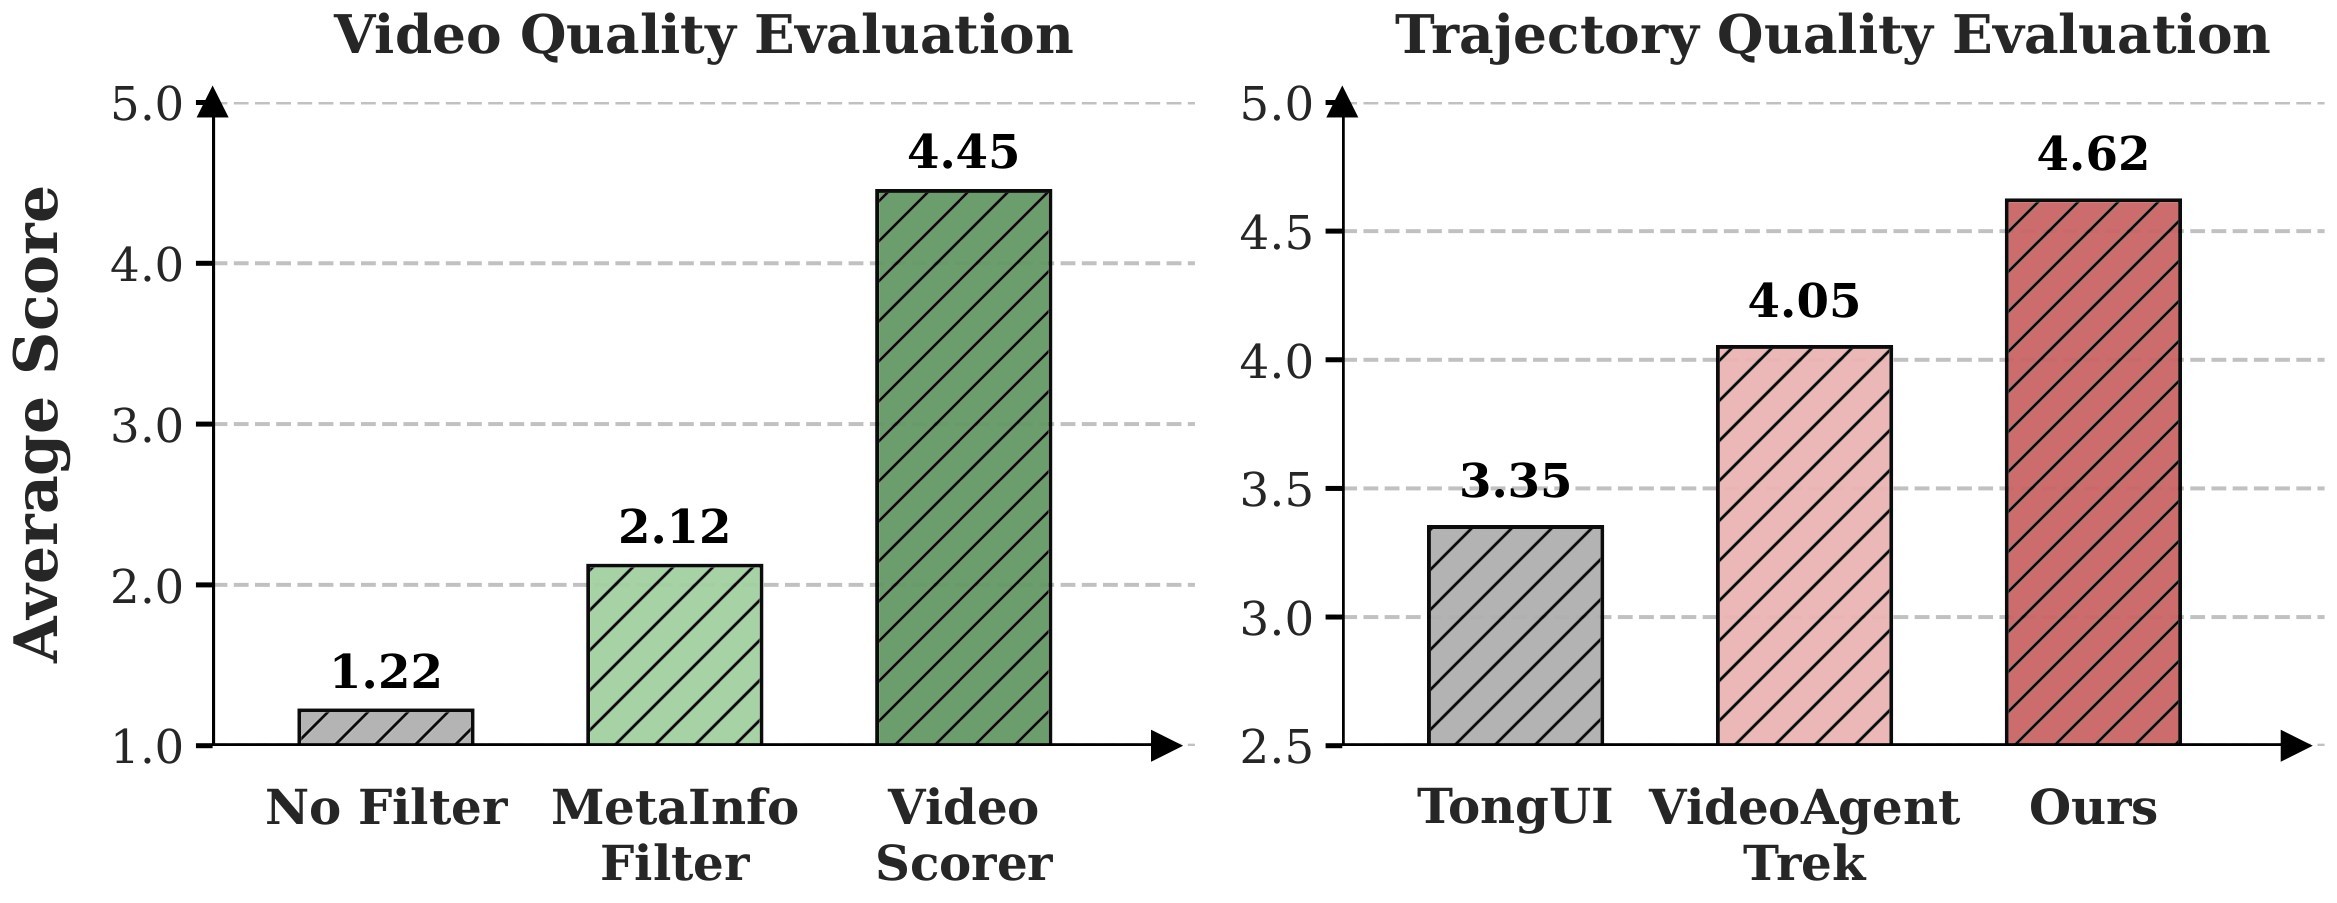
The data-quality check in Figure 4 is the paper's main guardrail against "large but noisy" data. Five expert participants rated 300 sampled data points. The video-quality pipeline improved average video scores from 1.22 to 2.12 after metadata filtering and to 4.45 after video scoring. For trajectory quality, WildGUI achieved 4.62, above TongUI at 3.35 and VideoAgentTrek at 4.05; the reported Krippendorff's \(\alpha\) is 0.84.
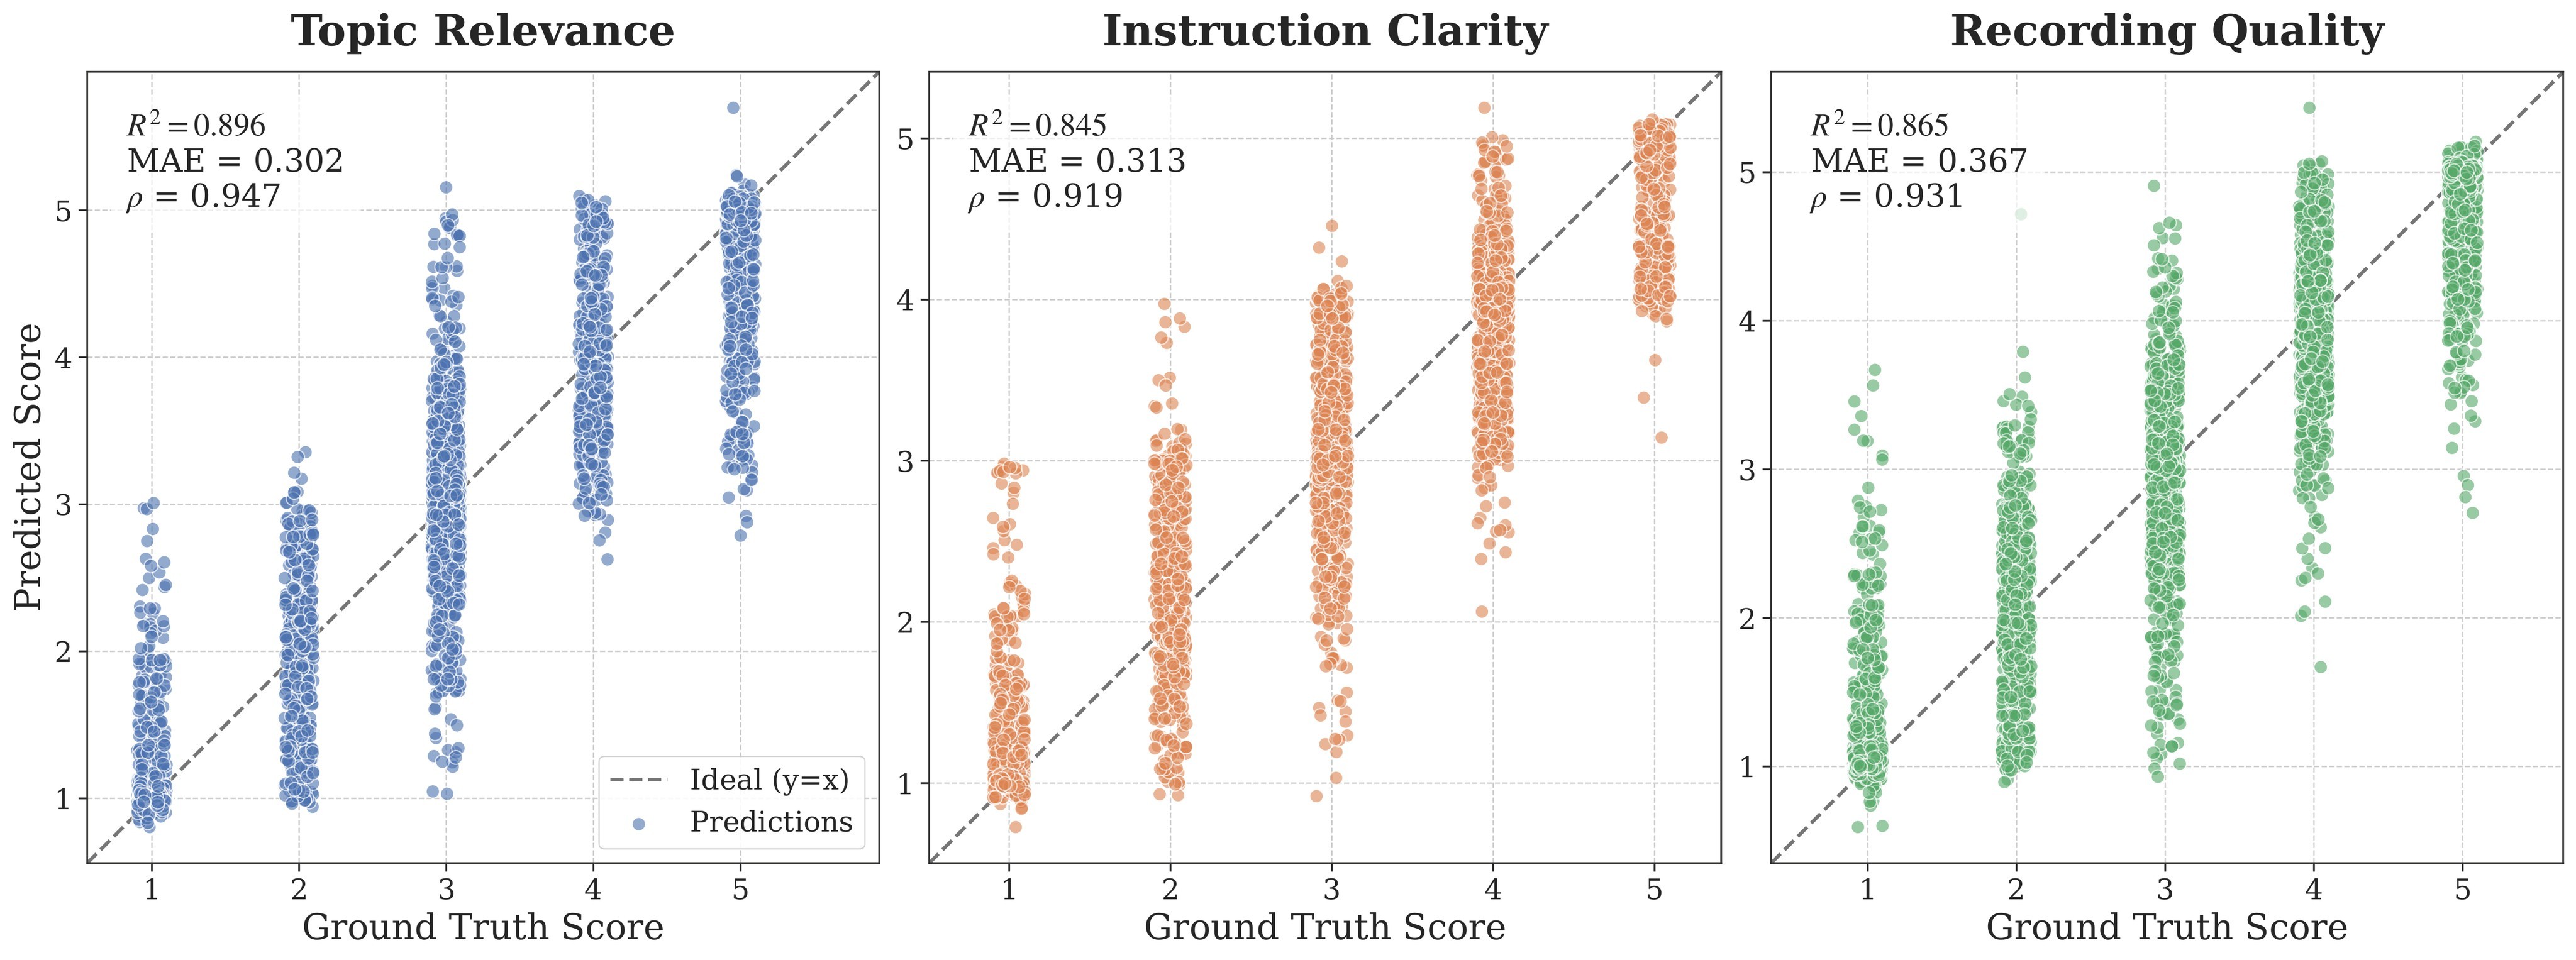
The scorer itself is evaluated in Figure 5, which reports alignment with ground-truth annotations over topic relevance, instruction clarity, and screen recording quality.
Practical Takeaways
The most important practical takeaway is that GUI-agent data may be hidden in ordinary tutorial videos, but the conversion pipeline has to solve two hard alignment problems: intent-to-step extraction and step-to-coordinate grounding. Video2GUI uses strong VLMs for both, then makes the result cheaper to scale with learned filters and scorers.
For model builders, WildGUI-like data is most compelling as Stage 1 pretraining, not as the only source of supervision. The ablation shows that removing Stage 2 hurts every reported metric, so clean supervised post-training remains necessary. The reported recipe also assumes large infrastructure: 24,000 Stage 1 steps, 2,000 Stage 2 steps, maximum 4,096 visual tokens, 32,768 sequence length, and a cluster with 256 NVIDIA GPUs.
The cost section is unusually concrete. With Gemini-3-Pro as the default annotator, trajectory extraction costs about $0.0653 per sample and action spatial grounding adds about $0.011, for about $0.0763 per sample end to end. The authors also evaluate Qwen3.5-397B-A17B as an open-source alternative but report roughly 15-20% lower annotation quality, mainly in temporal alignment and spatial grounding. That makes the release of the resulting dataset and pipeline more valuable than re-running the full pipeline for every downstream user.
The main caveat is that the reported evidence validates the pipeline internally rather than through an independent reproduction. The benchmark gains are broad and numerically strong, but the upstream labels depend on model annotation, quality thresholds, and expert sampling. Users should treat WildGUI as a high-value pretraining corpus whose quality should still be audited for target domains, languages, applications, and safety-sensitive workflows.
Reference Coverage
Anchor coverage check: evidence anchors are linked from the claims table and again here for problem framing, video filtering, trajectory and grounding, agent training, dataset scale, main results, scaling, ablation, data quality, and cost caveats. Figure anchors are linked here for Figure 1, Figure 2, Figure 3, Figure 4, Figure 5, Figure 6, Figure 7, Figure 8, Figure 9, Figure 10, and Figure 11. Table anchors are linked here for Table 1, Table 2, Table 3, Table 4, Table 5, and Table 6.