Source-first digest for checked paper rank 5, rank_id p006.
- Routing status:
pandoc_failed - PDF extraction: not used
Motivation / Background
Video diffusion models are increasingly framed as candidate world models because they generate plausible spatio-temporal sequences from large real-world training corpora. YoCausal asks whether that plausibility includes an intuitive grasp of cause and effect, or whether current video models mostly learn statistical temporal regularities. The paper focuses on observable event causality, such as an action producing a visible consequence, not formal structural causal models.
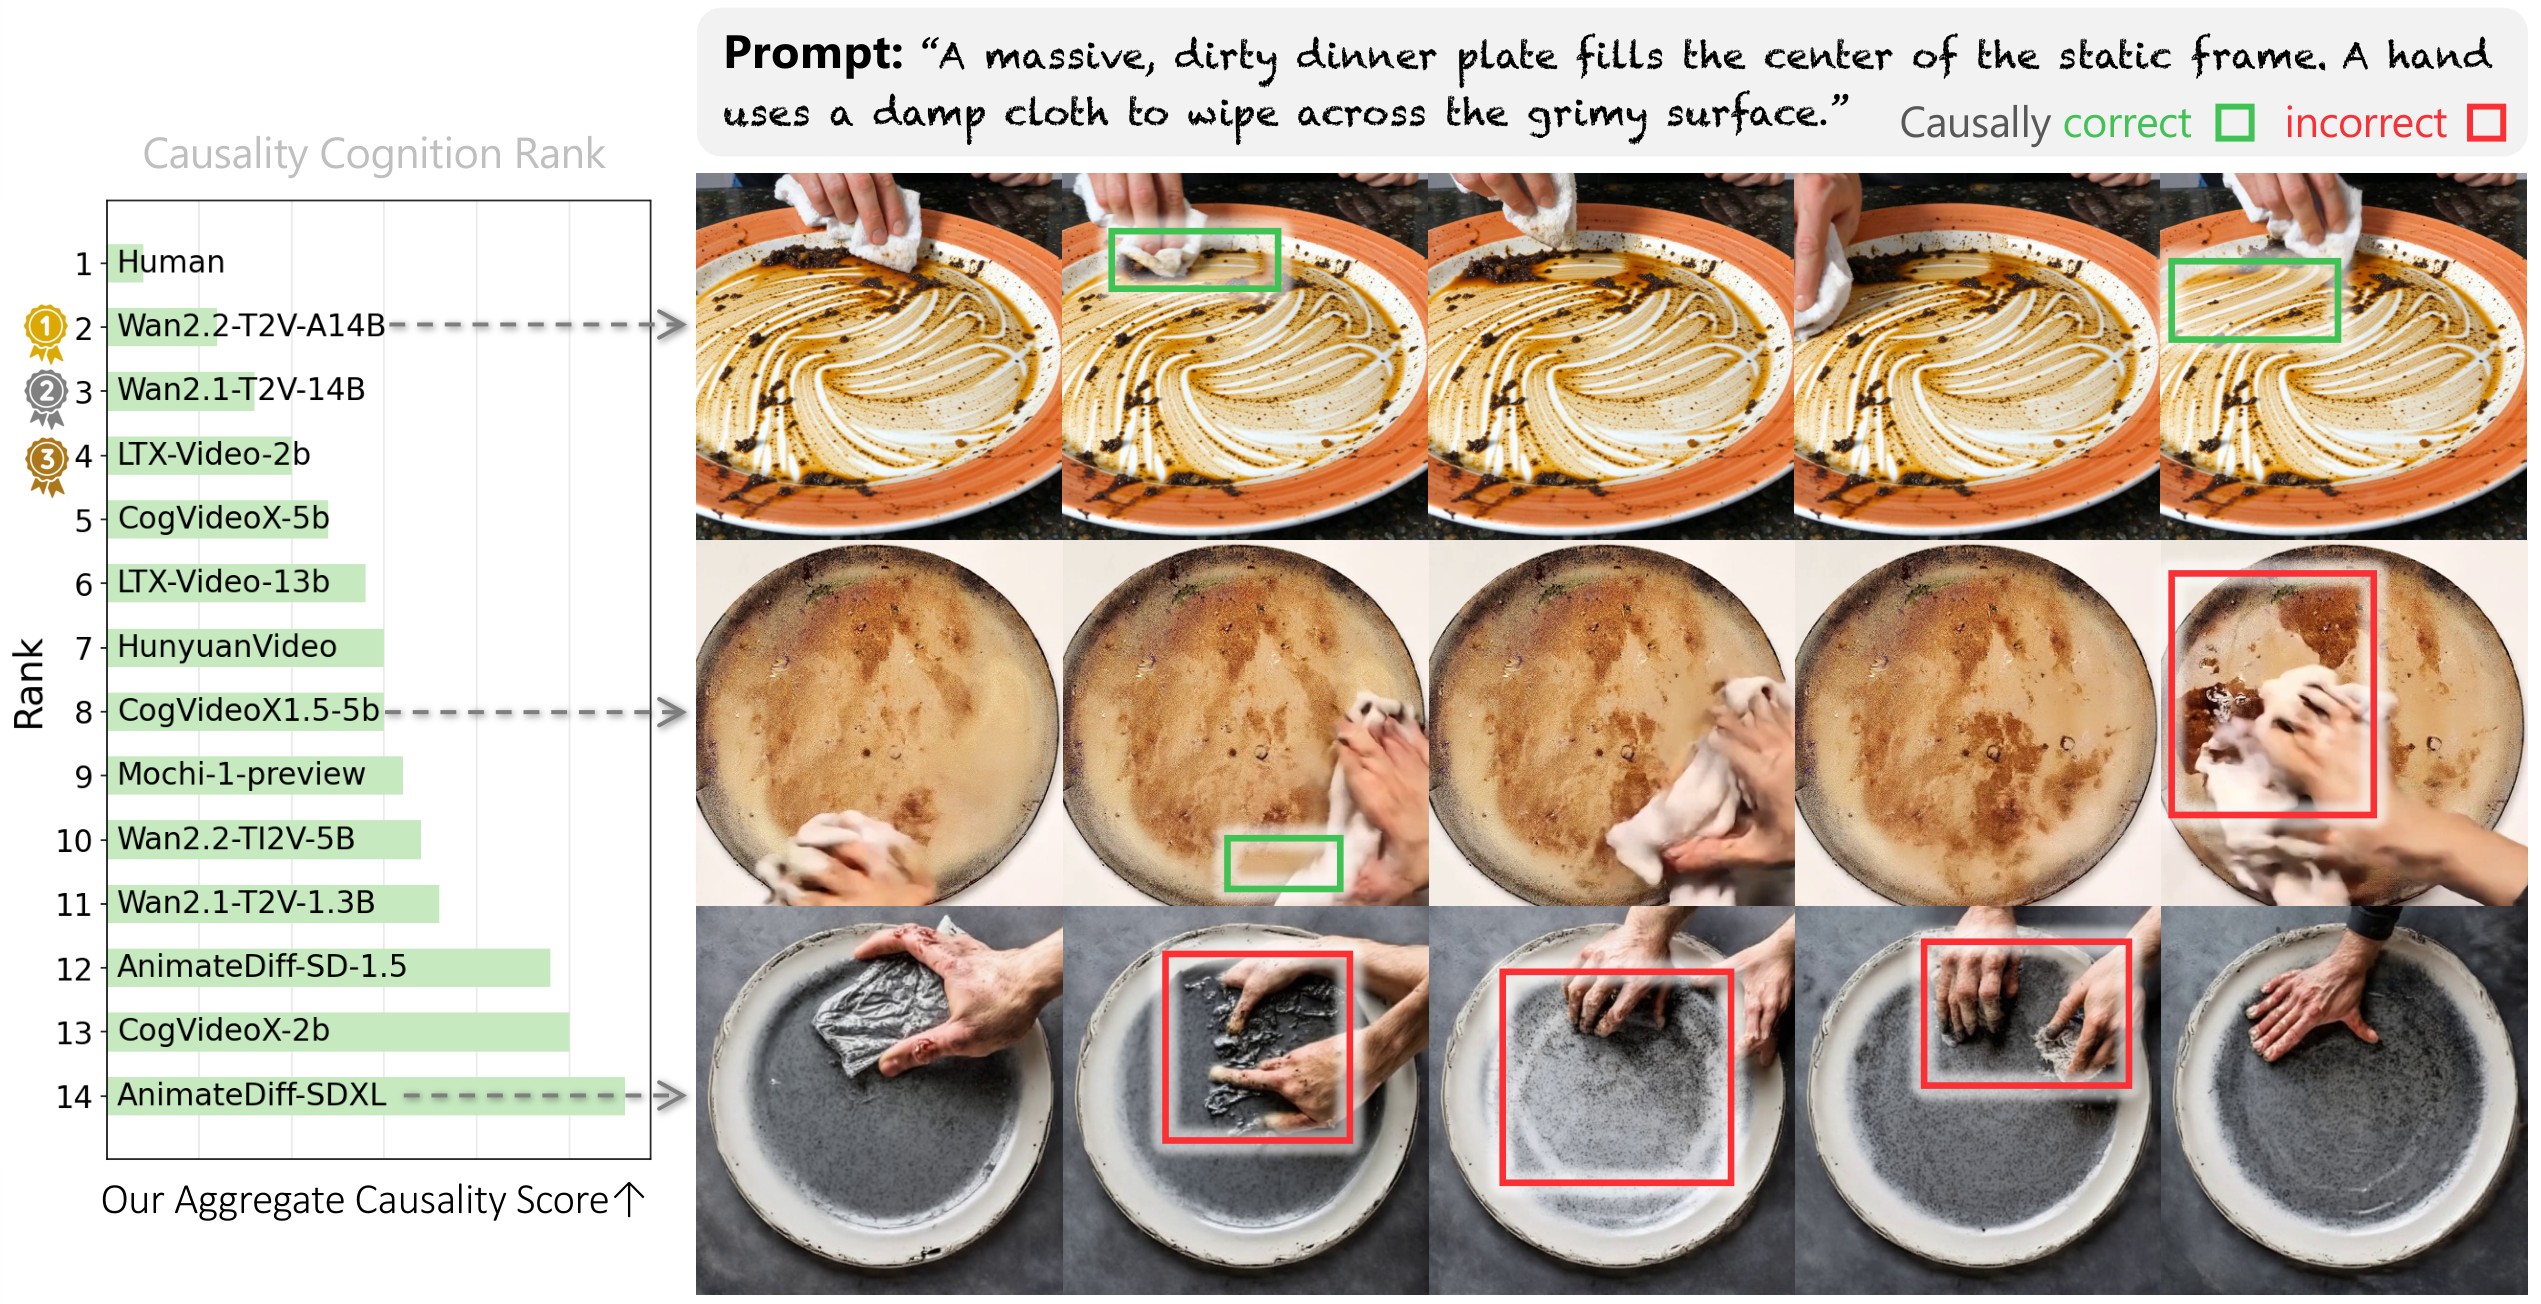
The central benchmarking move is borrowed from violation-of-expectation studies in cognitive science: if a model has internalized causal structure, a temporally reversed causal video should look more surprising than the forward version. The qualitative validation in Figure 1 previews the paper's main message: top models better preserve the causal progression in a generated "wiping a dirty plate" example, while weaker models let the dirt reappear or smear incoherently.
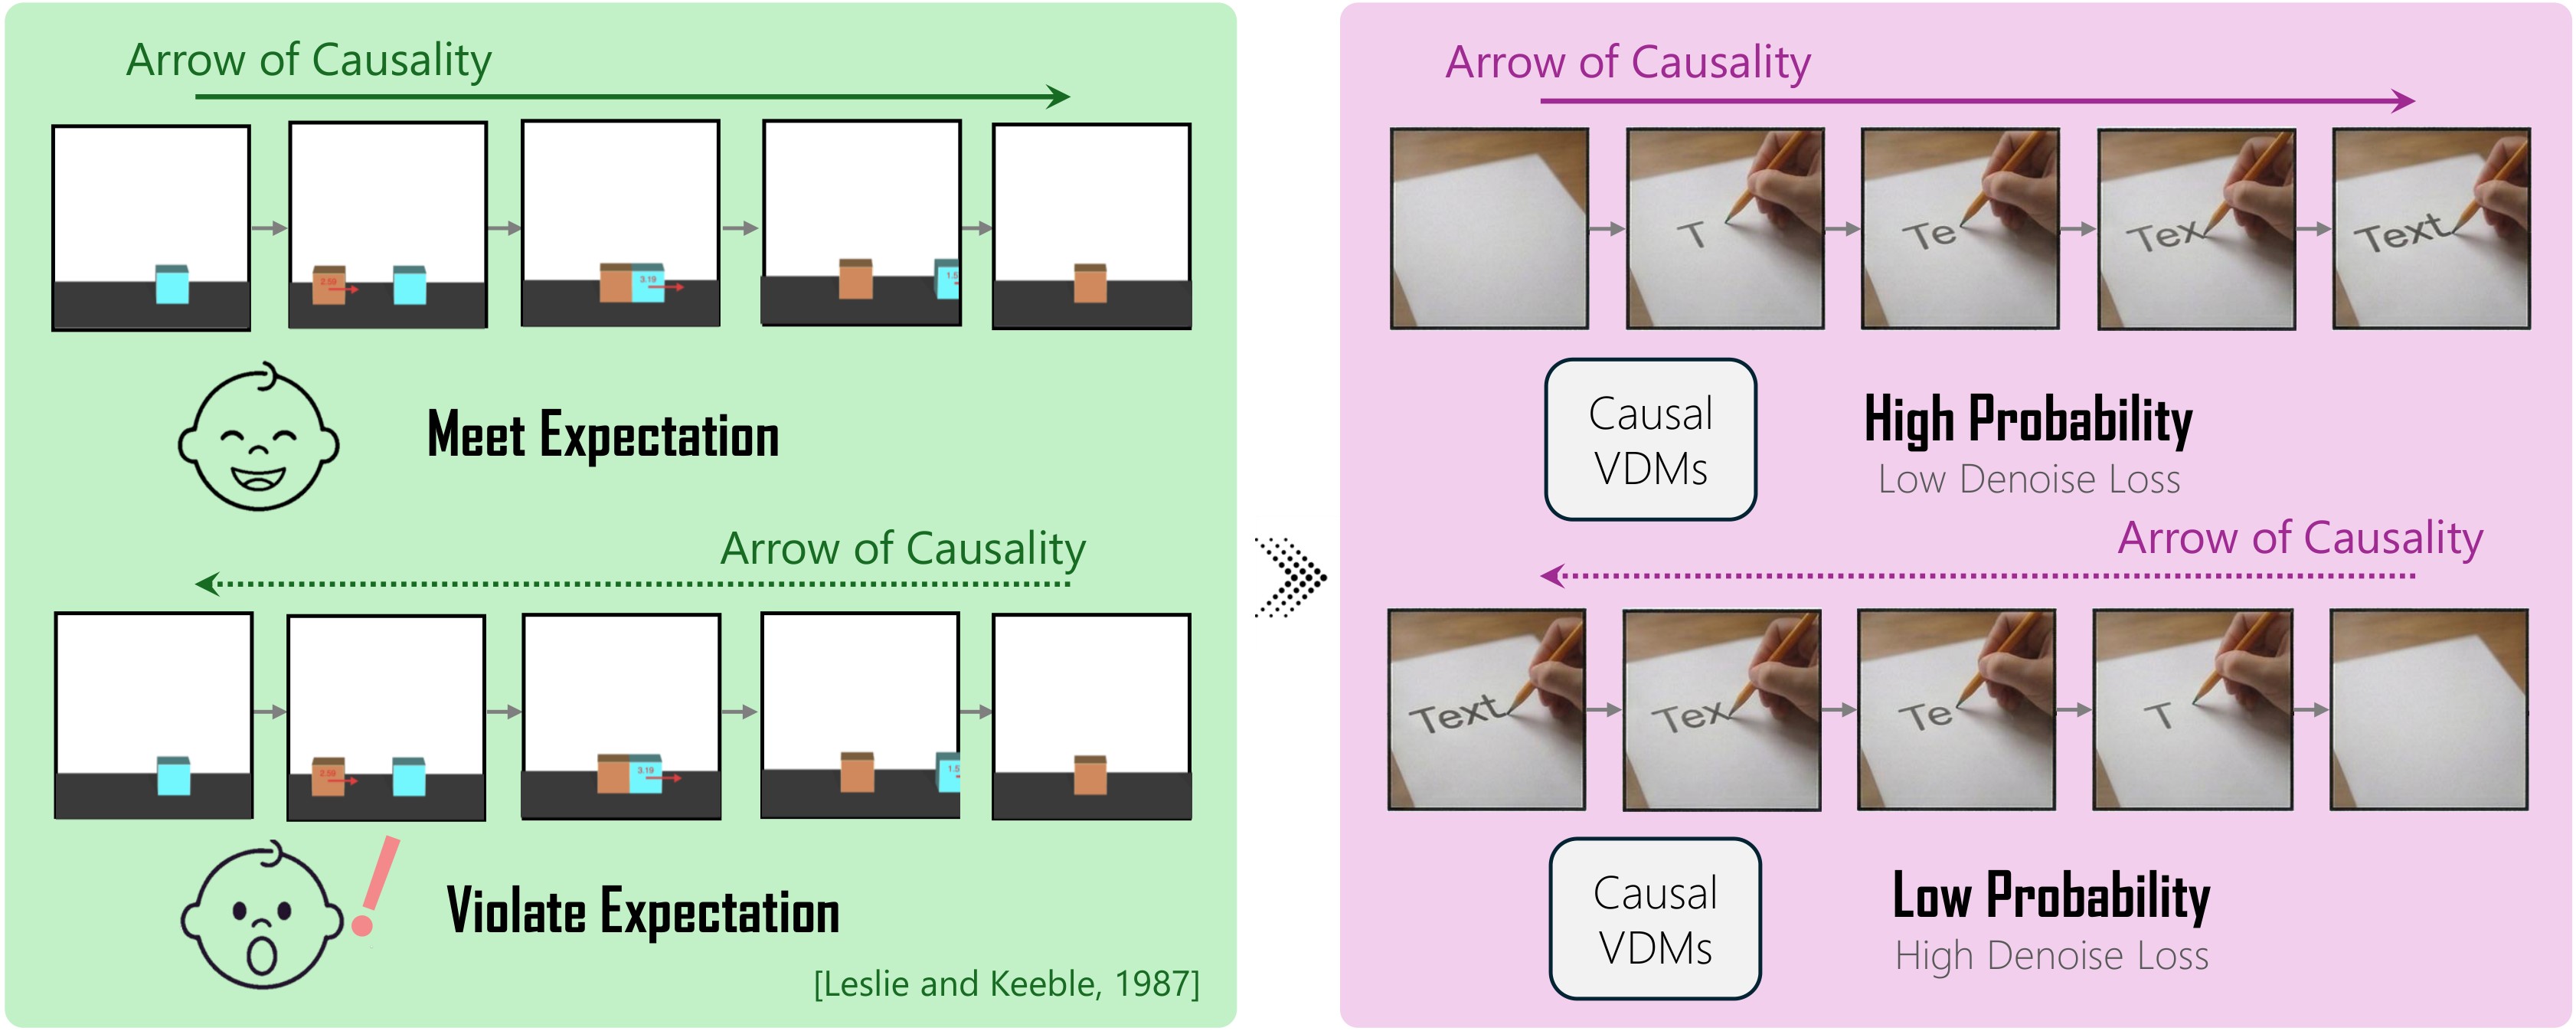
The cognitive-science analogy is made explicit in Figure 2: infants show surprise at reversed causal clips, and YoCausal maps surprise for a diffusion model to denoising loss. This lets the benchmark use real-world videos rather than synthetic physics scenes.
The paper argues that this matters because existing physics-oriented benchmarks are either synthetic or controlled-recording based. Table 1 captures the claimed coverage difference.
| Benchmark | Video type | Number of videos | Number of scenes |
|---|---|---|---|
| PhyWorld | Synthetic, 2D | 3,000,000 | 70 |
| LikePhys | Synthetic | 120 | 12 |
| Physion | Synthetic | 10,400 | 260 |
| IntPhys2 | Synthetic | 1,416 | 344 |
| Phys101 | Real-world, controlled | 2,500 | 101 |
| Physics IQ | Real-world, controlled | 396 | 132 |
| YoCausal | Real-world | 1,232 and extensible | 1,232 and extensible |
Table 1. Benchmark coverage comparison. The paper's claim is not that YoCausal has the most videos today, but that temporal reversal gives it scene diversity and an easy path to expansion.
Claims And Evidence
| Claim id | Main claim | Support | Evidence anchors |
|---|---|---|---|
| C1 | Temporally reversed real-world videos provide a scalable counterfactual protocol for testing causal cognition in video diffusion models. | 4 | paper framing, VoE motivation, dataset scale, dataset composition, framework overview |
| C2 | Denoising loss can operationalize "surprise"; RSI measures arrow-of-time perception by checking whether reversed clips have higher loss than forward clips. | 4 | denoising loss, RSI definition, RSI results |
| C3 | RSI alone is insufficient: CCI separates causal cognition from general temporal-direction bias by comparing RSI on VLM-stratified causal and non-causal subsets. | 4 | CCI idea, VLM judge setup, VLM validation, CCI results |
| C4 | Current open-source video diffusion models remain far from human-level causal cognition even when some detect the arrow of time. | 5 | RSI numerical results, CCI numerical results, aggregate ranking |
| C5 | Causal cognition is related to intuitive physics and to model scaling, but it is not reducible to aesthetic quality or generic video fidelity. | 4 | cross-metric analysis, scaling trends |
| C6 | The main signals are plausibly not artifacts of prompt-video mismatch or simple motion-magnitude entropy cues, though the supporting ablations are narrower than the main benchmark. | 3 | null-prompt ablation, motion-symmetric RSI |
Scores are support-from-paper scores, not independent reproduction scores. C1-C3 are capped below 5 because the benchmark depends on a denoising-loss proxy and a VLM-based causal/non-causal split, both of which the paper validates but does not make assumption-free.
Core Technical Idea
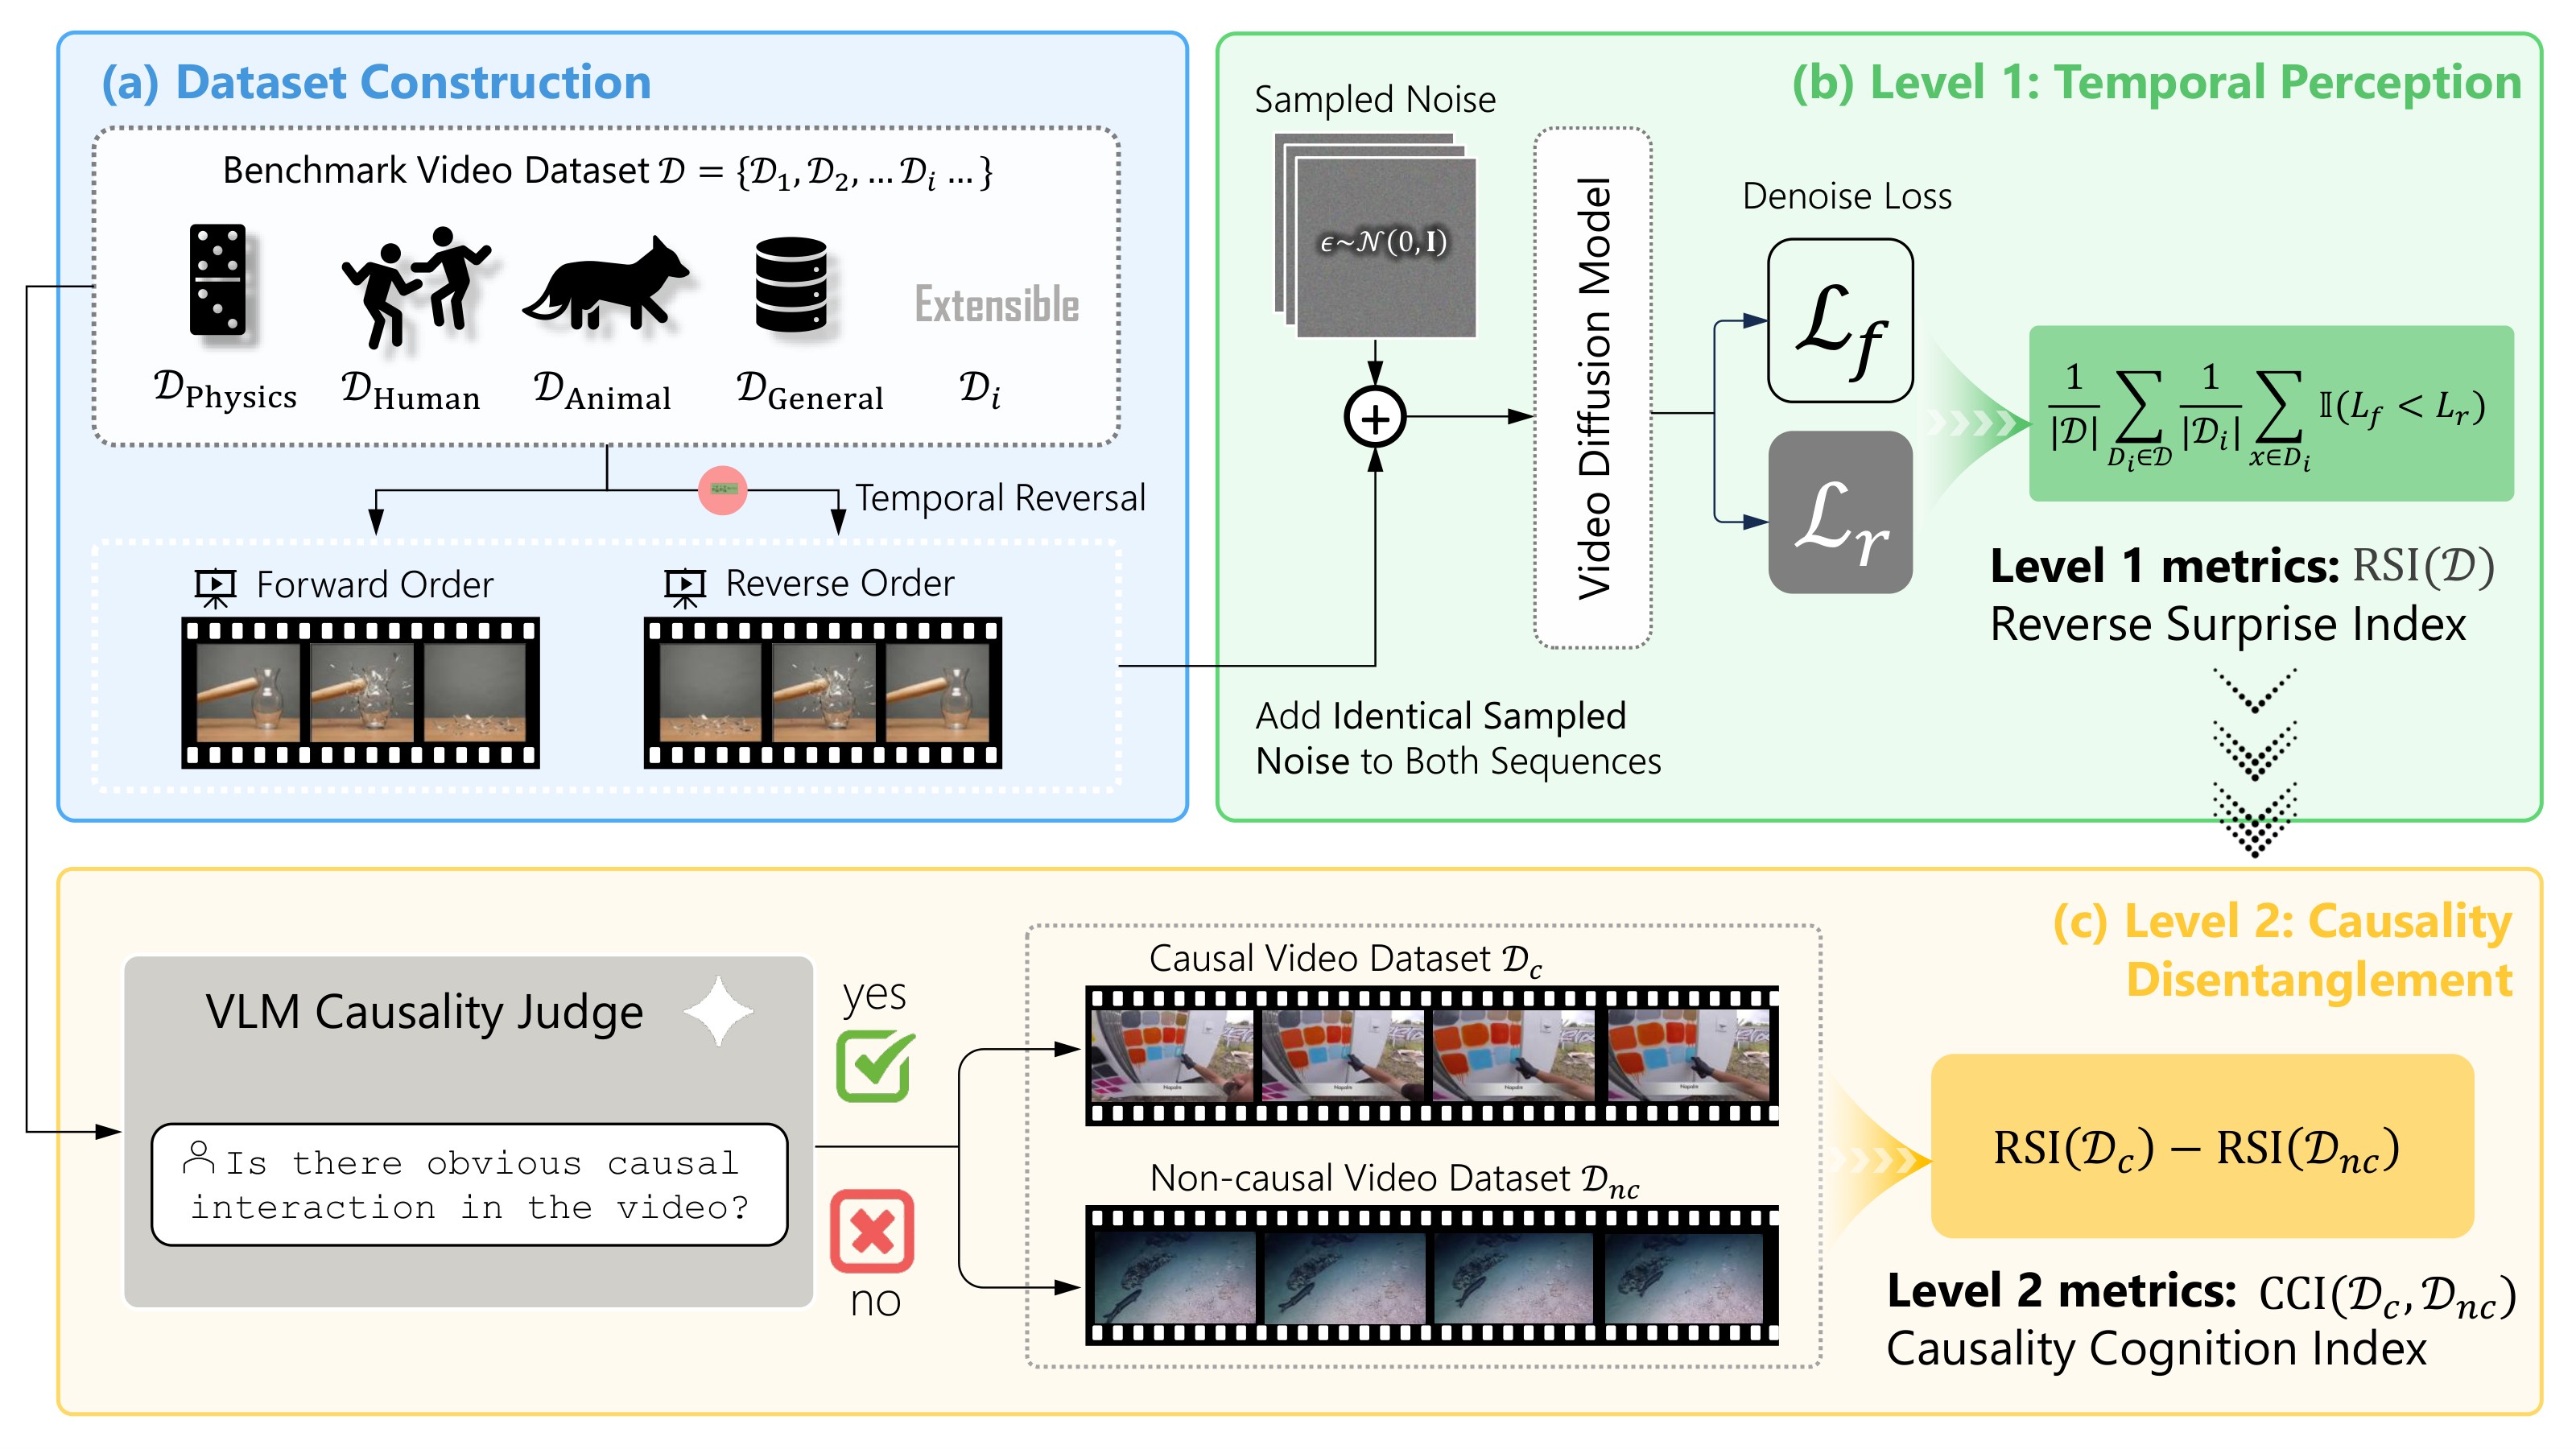
YoCausal evaluates a video diffusion model without asking it to generate a new answer. For each real video \(x\), the benchmark forms a forward sequence \(x^f\) and a reversed sequence \(x^r\). It feeds both versions through the model's denoising objective under matched noise and timestep sampling. If the reversed clip has larger denoising loss, the model is interpreted as being more surprised by the reversed temporal order.
Figure 3 is the main framework figure: construct forward/reverse pairs from real videos, compute the Level-1 Reverse Surprise Index, then split the dataset into causal and non-causal subsets for the Level-2 Causality Cognition Index.
The paper treats diffusion denoising loss as an empirical negative-log-likelihood proxy:
Therefore, a causally or temporally unexpected sequence should have higher denoising loss. For a reversed clip:
The Reverse Surprise Index is:
Higher RSI means the model more often assigns higher loss to the reversed version. The paper samples \(K=10\) timesteps and \(N_\epsilon=1\) noise sample per timestep, using identical timesteps and Gaussian noise for the forward and reversed sequences.
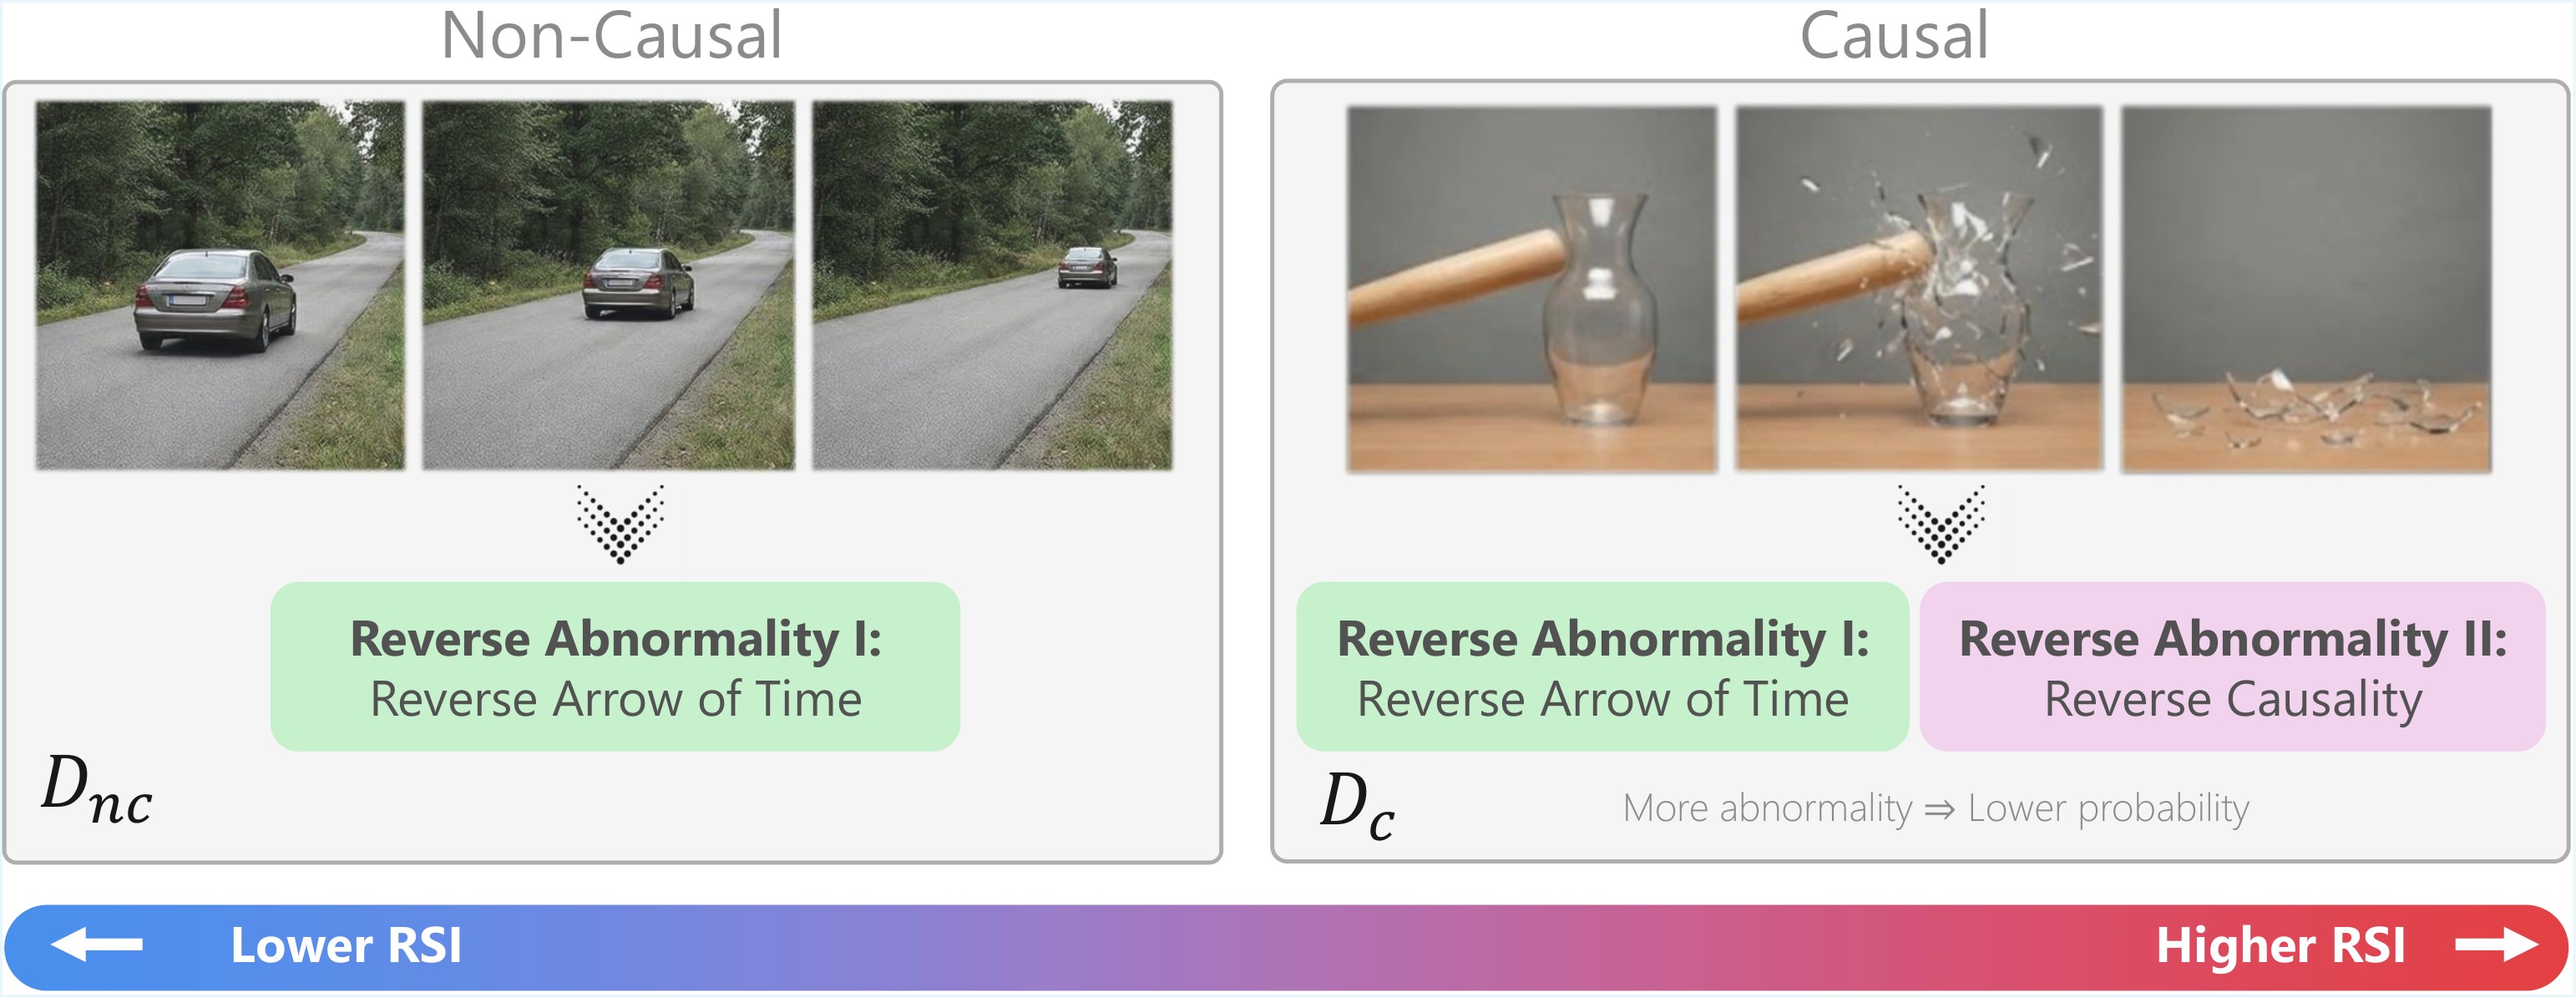
The blind spot is that reversed non-causal videos can still be temporally odd. Figure 4 explains the paper's split: non-causal videos mainly test arrow-of-time sensitivity, while causal videos add an inverted cause-effect relation.
The Causality Cognition Index is:
A high CCI means the model is more surprised by reversed causal clips than by reversed non-causal clips, beyond general temporal-order sensitivity.
Method Details
Dataset And Models
The benchmark uses four real-world subsets. Table 2 is the concrete dataset composition used in the experiments.
| Subset | Source dataset | Clip duration | Videos |
|---|---|---|---|
| \(\mathcal{D}_{General}\) | Moments in Time | 3 s | 500 |
| \(\mathcal{D}_{Physics}\) | Physics IQ | first 5 s | 132 |
| \(\mathcal{D}_{Human}\) | Kinetics-400 | first 3 s | 400 |
| \(\mathcal{D}_{Animal}\) | Animal Kingdom | first 3 s | 200 |
| Total | multiple real-world sources | mixed | 1,232 |
Table 2. YoCausal dataset composition. The subsets intentionally span daily events, physical interactions, human action, and animal behavior.
The model suite contains 13 open-source text-to-video diffusion models: AnimateDiff-SD1.5/SDXL, CogVideoX-2B/5B, CogVideoX1.5-5B, Mochi-1-preview, HunyuanVideo, Wan2.1-T2V-1.3B/14B, Wan2.2-TI2V-5B/T2V-A14B, and LTX-Video-2B/13B. The paper uses each model's official settings for resolution, frames, and FPS, and does not use classifier-free guidance because evaluation directly compares predicted noise to sampled Gaussian noise rather than running full generation.
Video preprocessing adapts resolution, FPS, and long clips to each model. For clips longer than a model's frame window, the video is split into consecutive windows, with context padding for the final short segment; only non-context frames contribute to denoising loss.
VLM-Based Causal Split
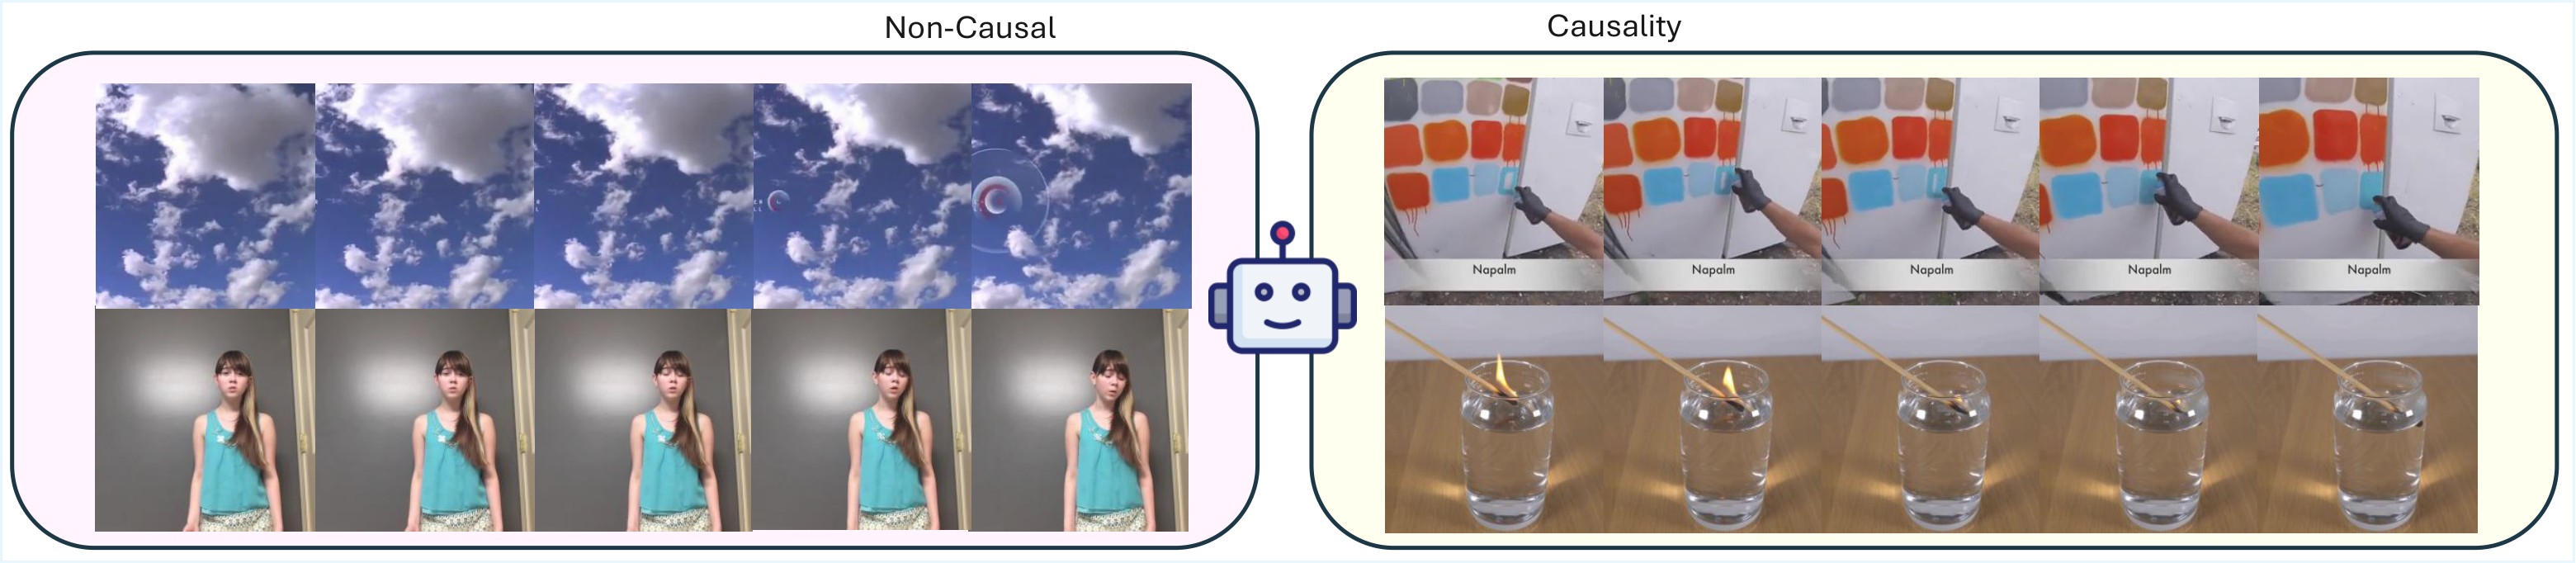
YoCausal needs a scalable way to label whether a video contains salient cause-effect structure. The paper uses Gemini 3.0 Pro as a VLM judge with a JSON-output prompt asking whether Event A visibly causes Event B. The examples in Figure 5 show the intended split between non-causal and causal videos.
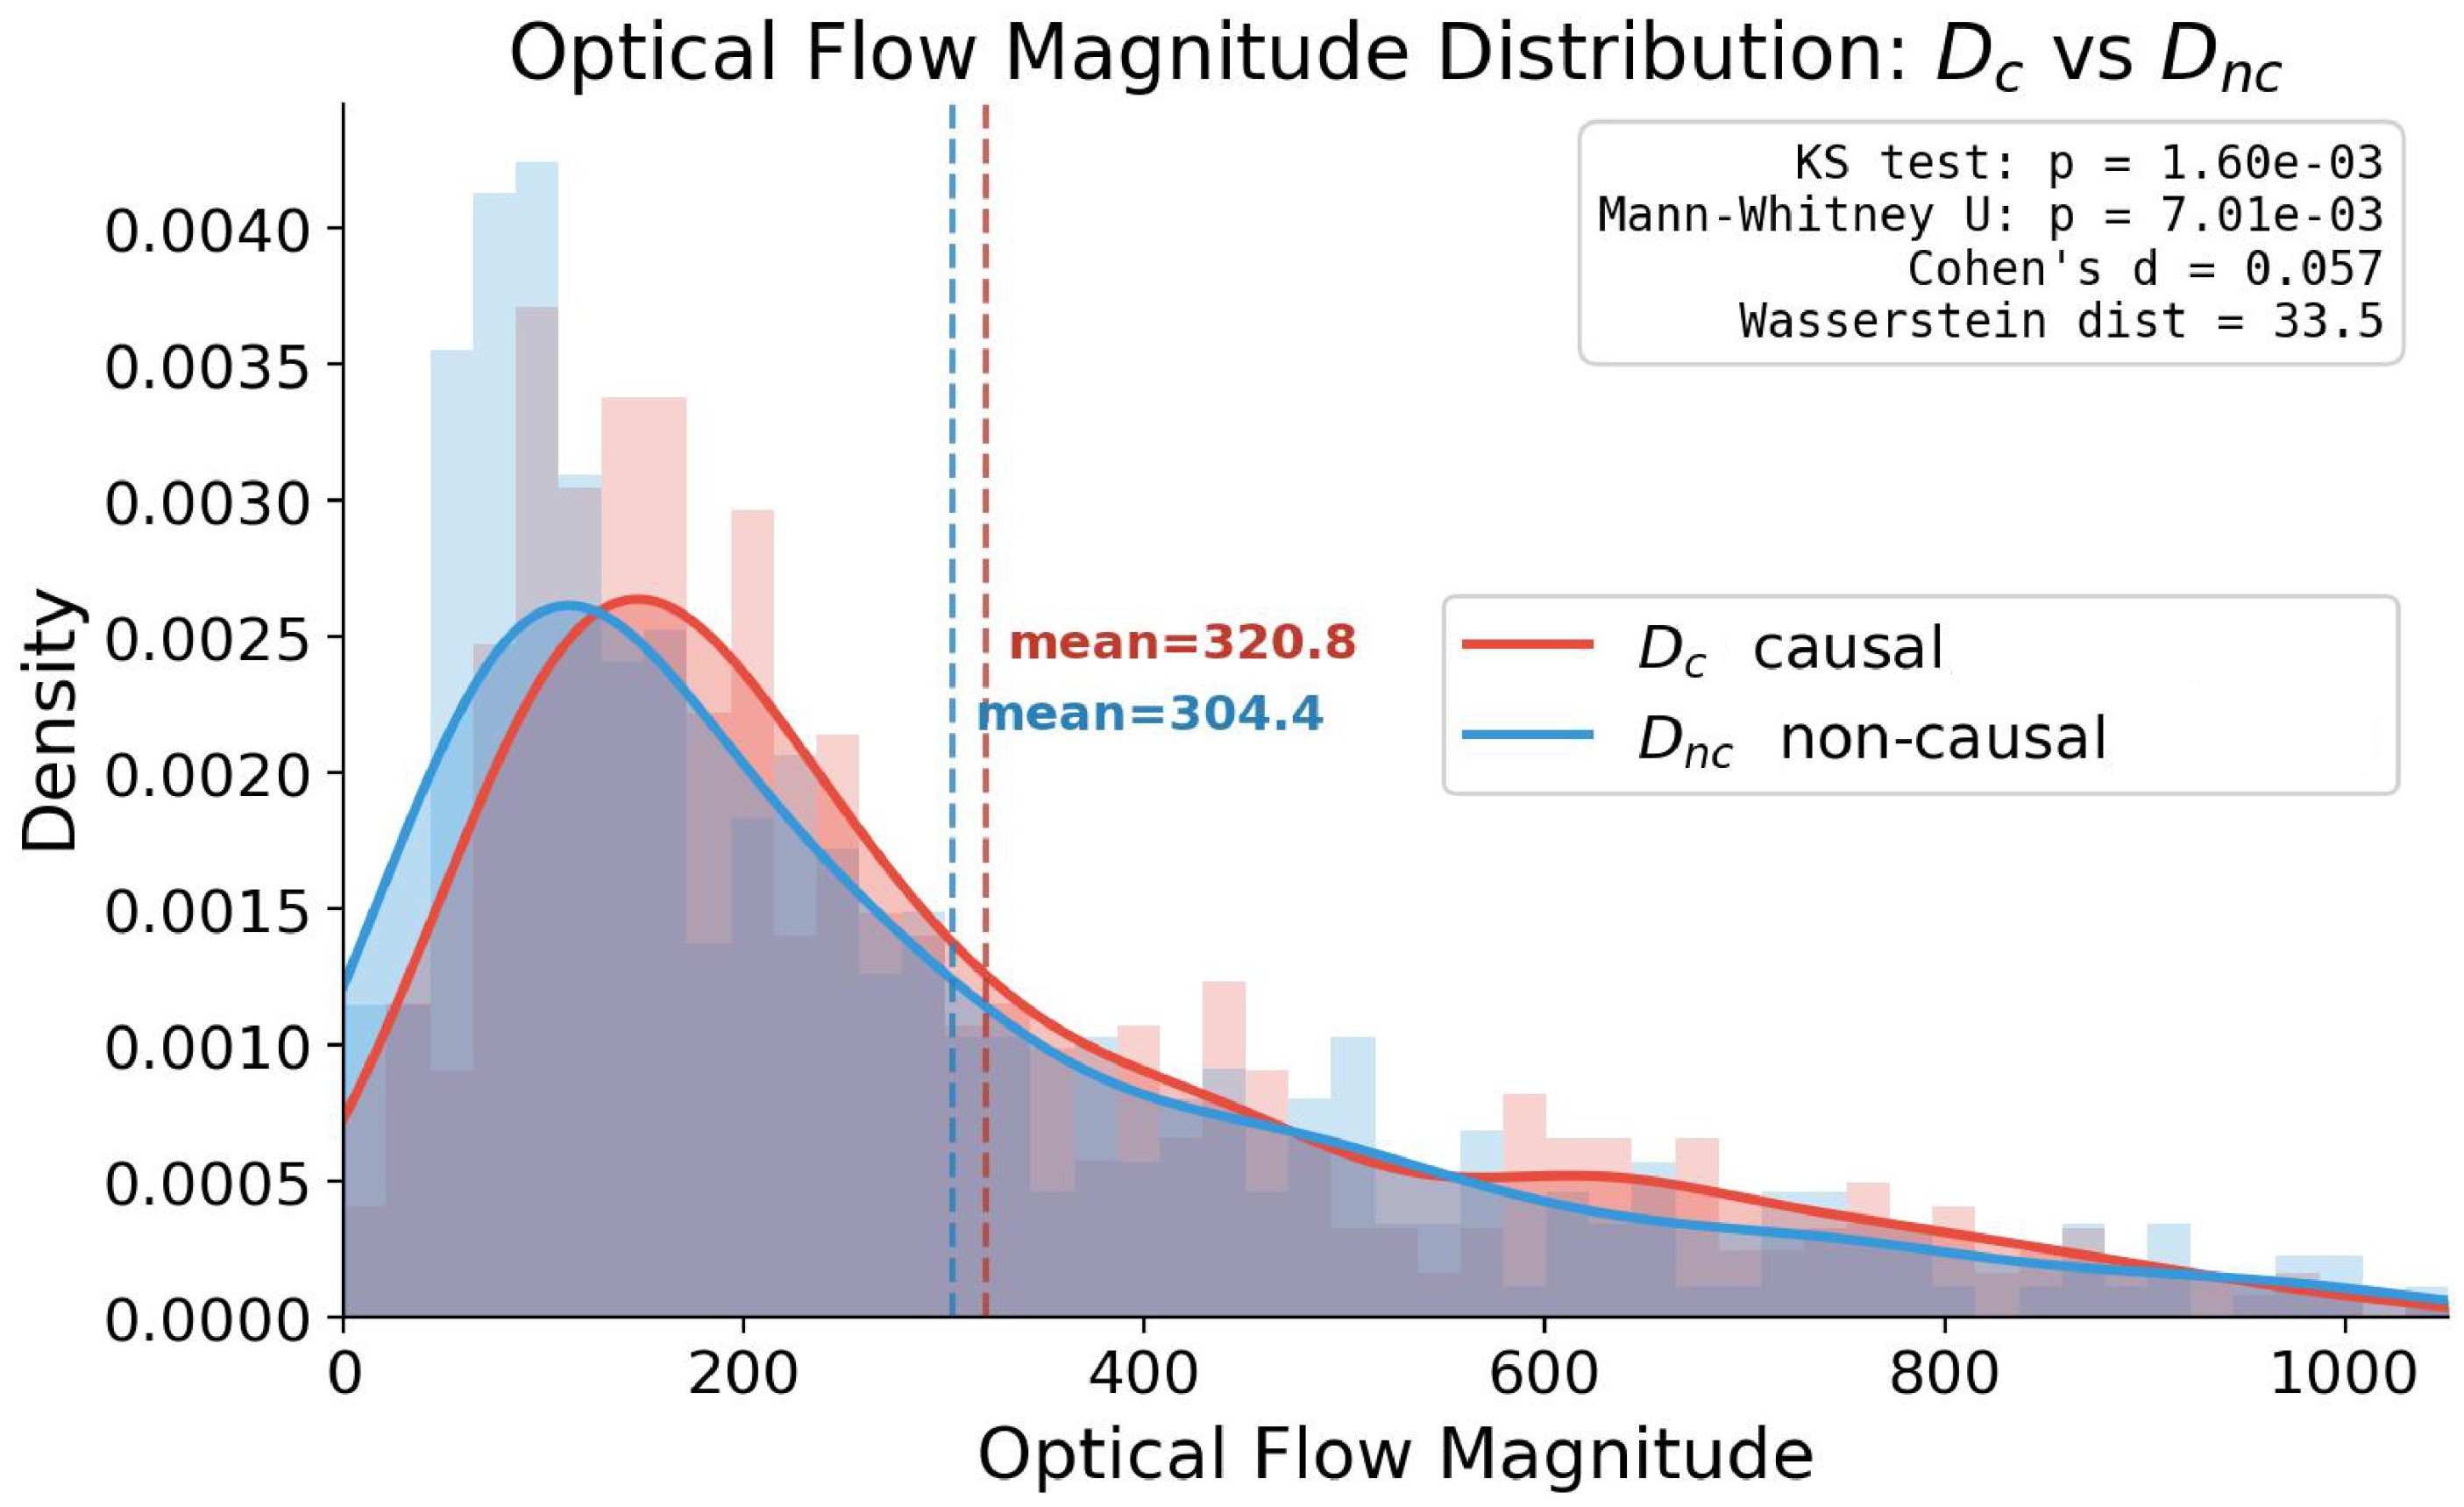
The split is a potential weak point, so the paper validates it in two ways shown in Figure 6: causal and non-causal subsets have negligible low-level optical-flow magnitude difference, and the VLM split agrees reasonably with human annotation.
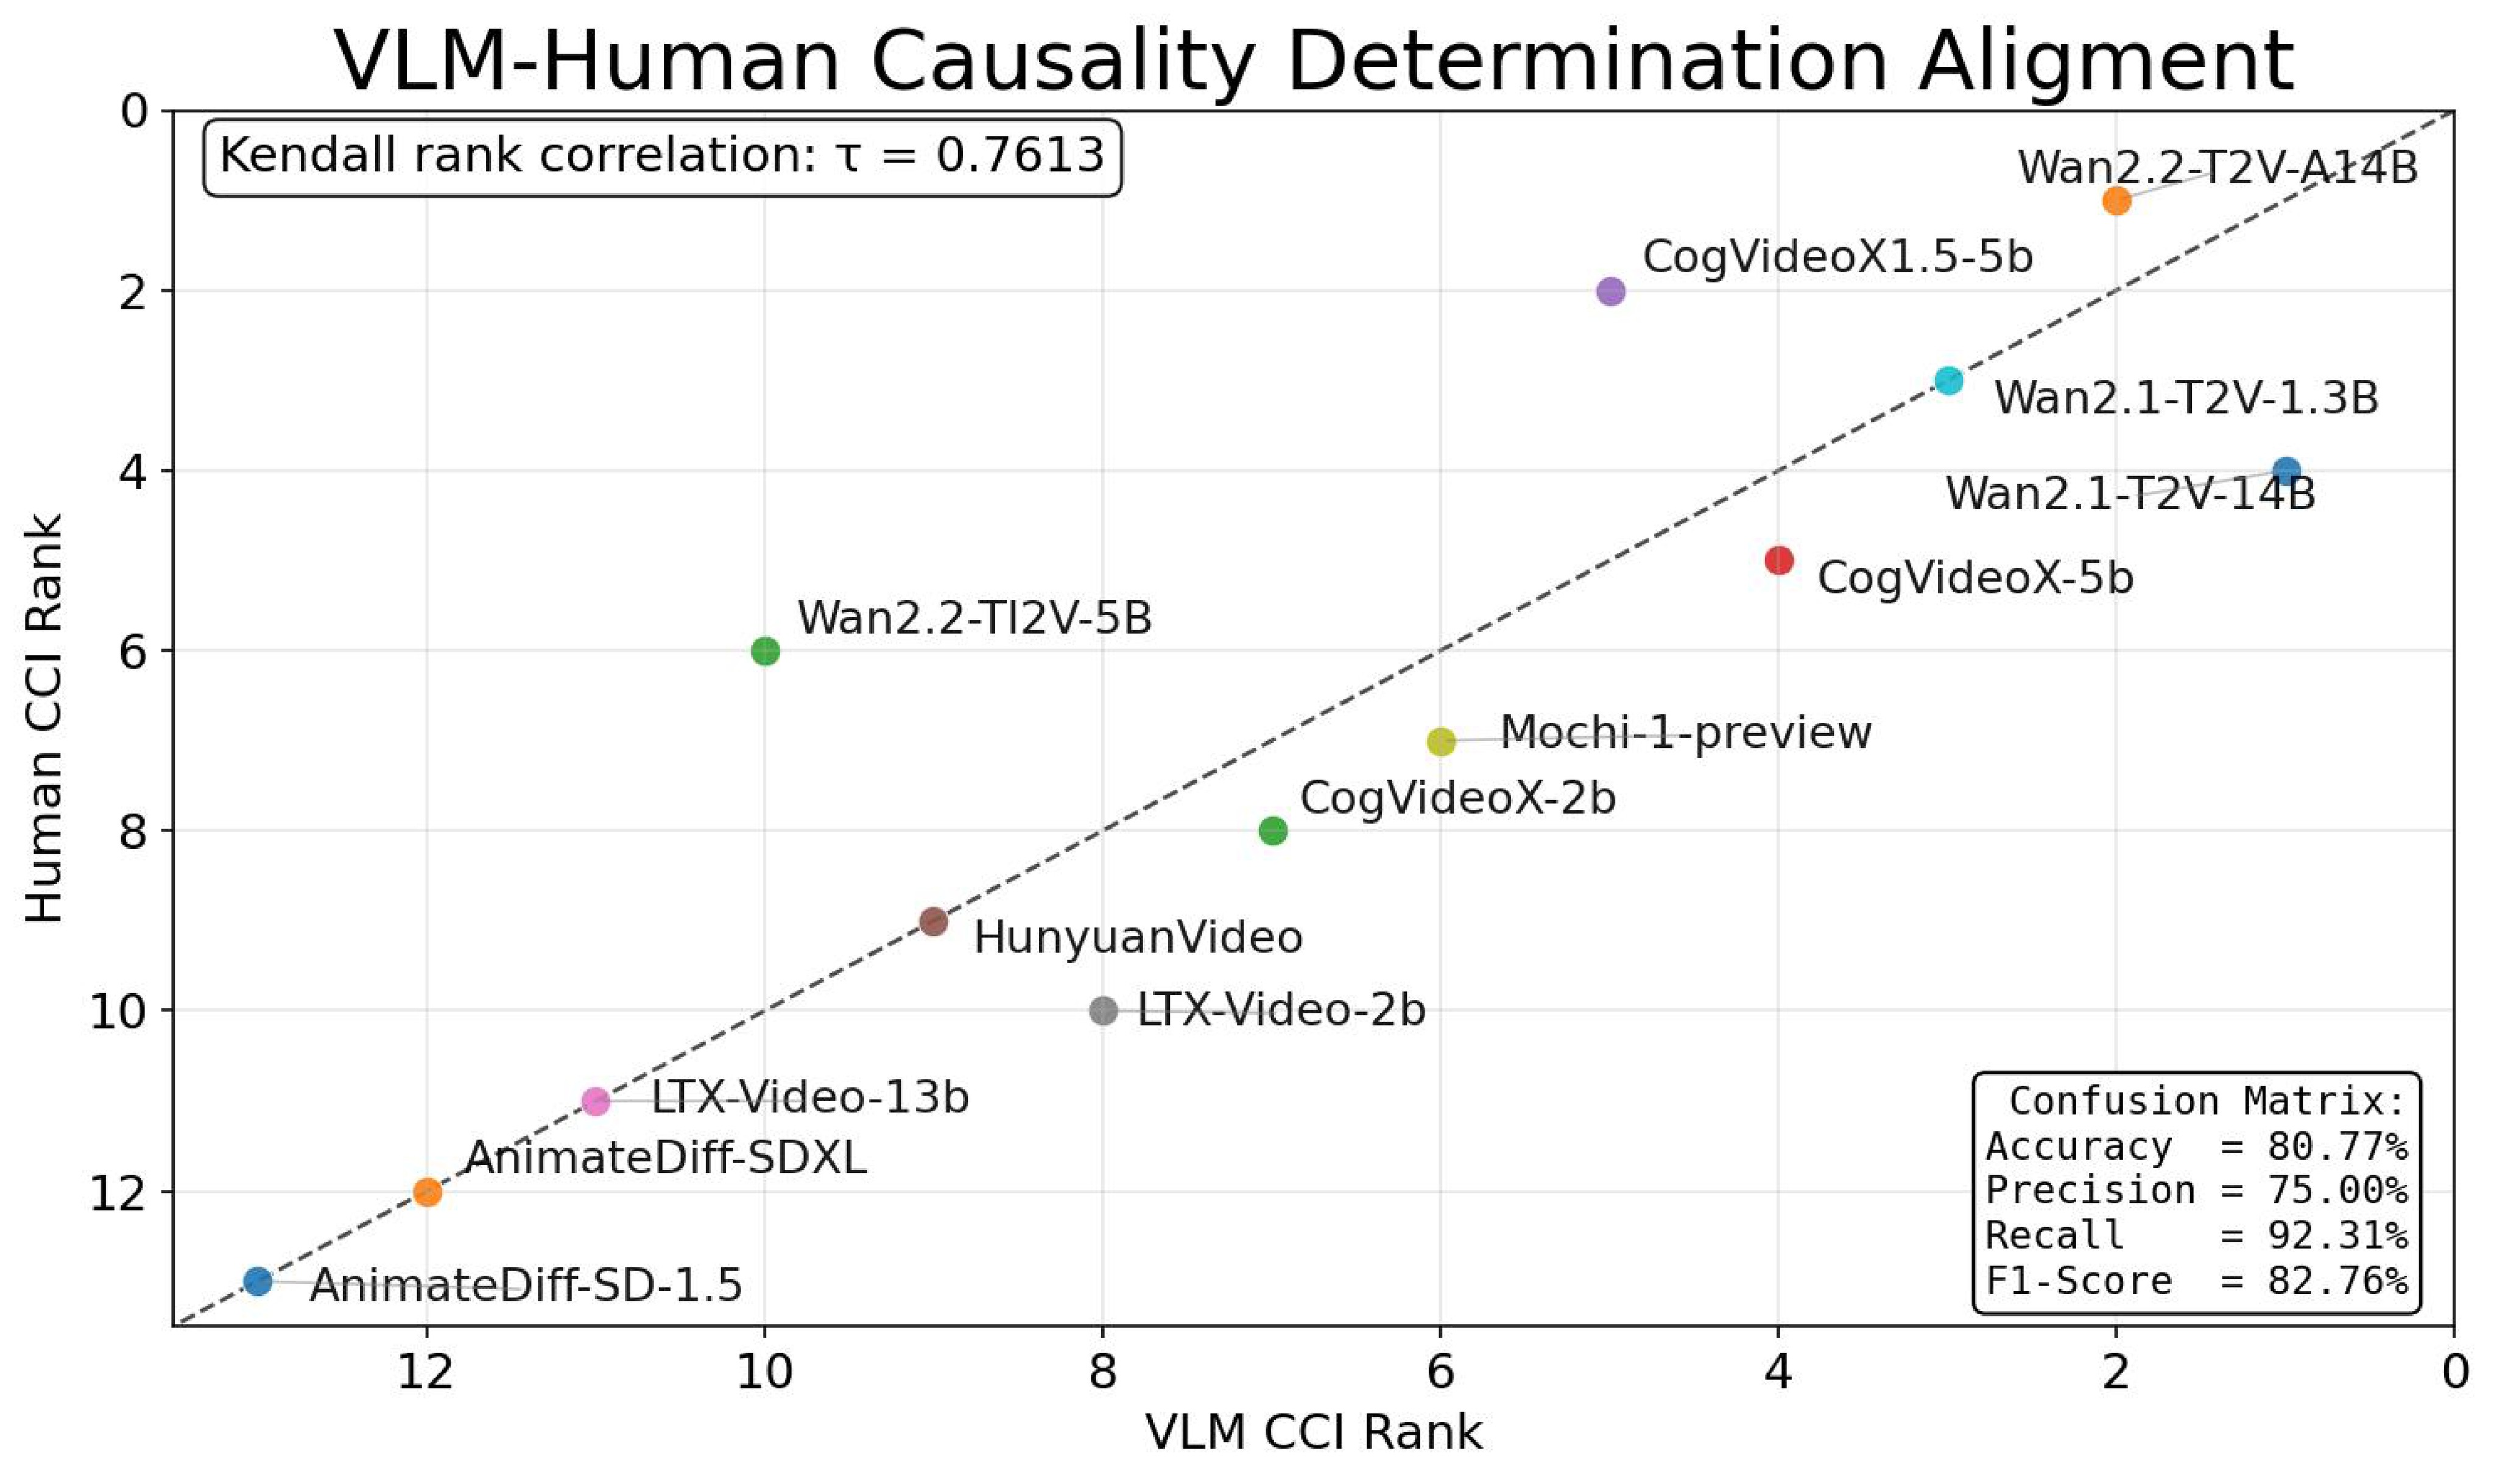
The paper also reports VLM-sensitivity results in Table 3, rerunning the partition with Gemini 3.0 Pro, GPT-4o, and Qwen3.5 9B and comparing induced aggregate rankings.
| Kendall tau / p-value | Gemini 3.0 Pro | GPT-4o | Qwen3.5 9B |
|---|---|---|---|
| Gemini 3.0 Pro | 1.000 / 0.0000 | 0.6923 / 0.0005 | 0.6666 / 0.0009 |
| GPT-4o | 0.6923 / 0.0005 | 1.000 / 0.0000 | 0.6666 / 0.0009 |
| Qwen3.5 9B | 0.6666 / 0.0009 | 0.6666 / 0.0009 | 1.000 / 0.0000 |
Table 3. VLM sensitivity of aggregate rankings. The correlations support robustness to the choice of VLM judge, though they are not perfect and should be treated as validation rather than ground truth.
Human Baseline
Human annotators label the temporal direction of all 1,232 videos. They see the prompt, then watch forward and reversed versions in randomized order and choose which is reversed. Each clip can be replayed at most three times to focus attention on high-level causal reasoning rather than artifact hunting. An Unknown option is assigned an expected win rate of 0.5, matching random guessing; the source text reports about 20% of samples marked Unknown.
Experiments And Results
Level 1: RSI
Figure 7 and Table 4 show Level-1 arrow-of-time perception. Some models beat the 50% baseline, especially LTX-Video and Wan variants, but all stay far below the human average.
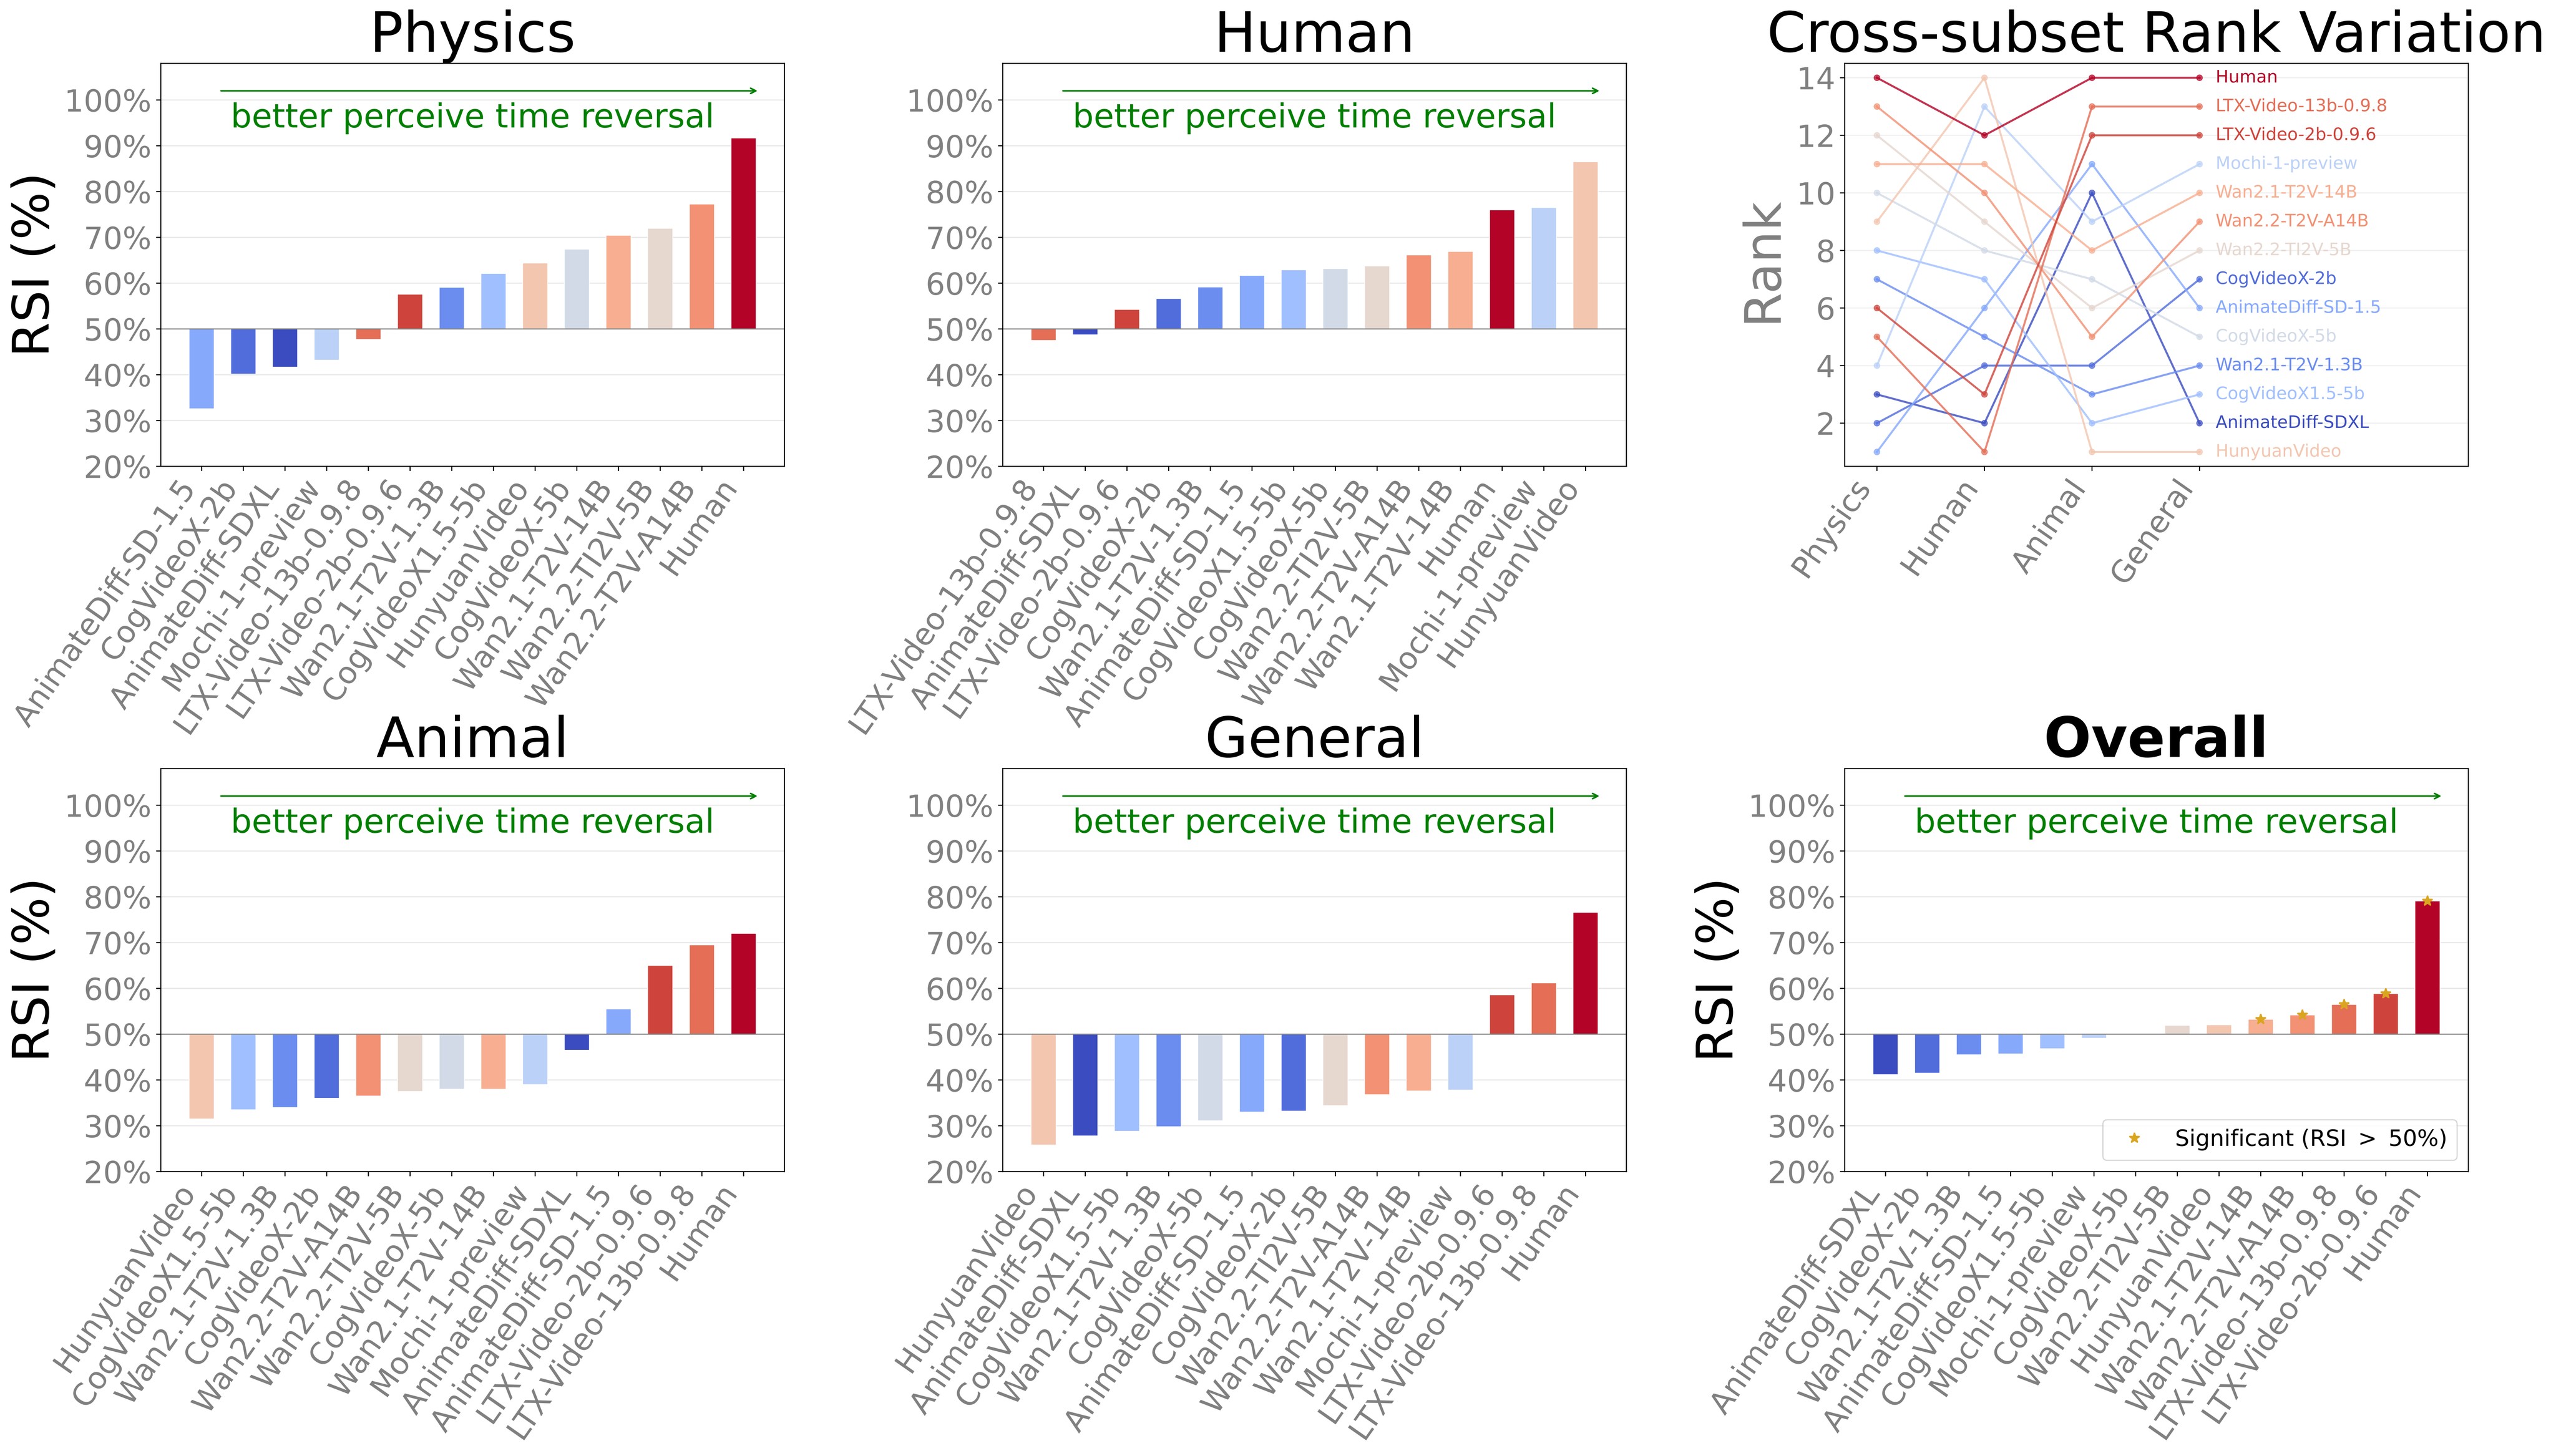
| Model | Release | General | Physics | Human | Animal | RSI(D) |
|---|---|---|---|---|---|---|
| AnimateDiff-SDXL | 04/2024 | 27.80% | 41.67% | 48.73% | 46.50% | 41.18% |
| CogVideoX-2B | 08/2024 | 33.20% | 40.15% | 56.64% | 36.00% | 41.50% |
| Wan2.1-T2V-1.3B | 03/2025 | 29.80% | 59.09% | 59.15% | 34.00% | 45.51% |
| AnimateDiff-SD1.5 | 06/2023 | 33.00% | 32.58% | 61.68% | 55.50% | 45.69% |
| CogVideoX1.5-5B | 11/2024 | 28.80% | 62.12% | 62.91% | 33.50% | 46.83% |
| Mochi-1-preview | 10/2024 | 37.80% | 43.18% | 76.50% | 39.00% | 49.12% |
| CogVideoX-5B | 08/2024 | 31.10% | 67.42% | 63.16% | 38.00% | 49.92% |
| Wan2.2-TI2V-5B | 07/2025 | 34.40% | 71.97% | 63.75% | 37.50% | 51.91% |
| HunyuanVideo | 11/2025 | 25.80% | 64.39% | 86.50% | 31.50% | 52.05% |
| Wan2.1-T2V-14B | 03/2025 | 37.60% | 70.45% | 66.92% | 38.00% | 53.24% |
| Wan2.2-T2V-A14B | 07/2025 | 36.80% | 77.27% | 66.17% | 36.50% | 54.19% |
| LTX-Video-13B-0.9.8 | 07/2025 | 61.20% | 47.73% | 47.50% | 69.50% | 56.48% |
| LTX-Video-2B-0.9.6 | 04/2025 | 58.60% | 57.58% | 54.25% | 65.00% | 58.86% |
| Human | reference | 76.60% | 91.70% | 76.00% | 72.00% | 79.08% |
Table 4. Numerical RSI results. LTX-Video-2B has the best model average at 58.86%, while humans average 79.08%.
Level 2: CCI
The CCI results are the paper's stronger causal-cognition test. Figure 8 and Table 5 show that high RSI does not guarantee high CCI: LTX-Video models have strong RSI but near-zero or negative CCI, while Wan and CogVideo models rank better on causal-vs-non-causal separation.
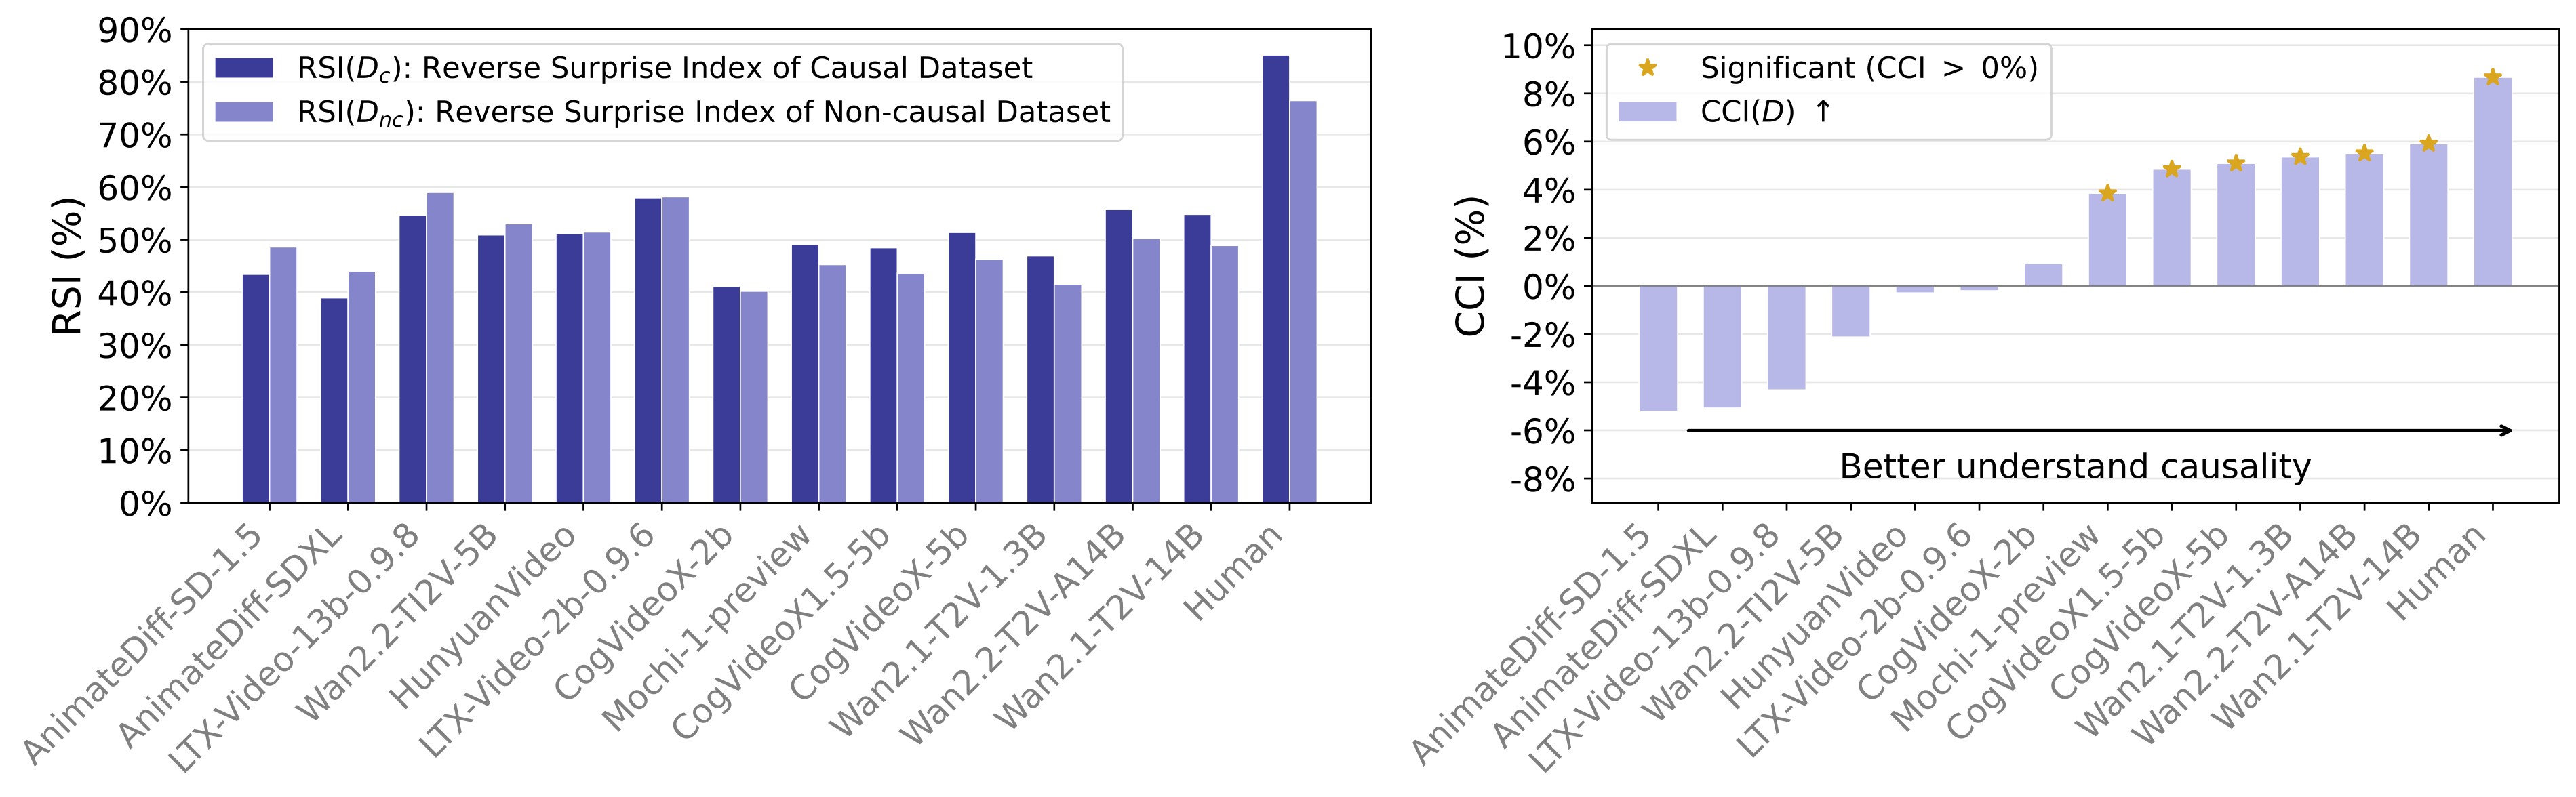
| Model | Release | CCI(D) | Normalized CCI | RSI(Dc) | RSI(Dnc) |
|---|---|---|---|---|---|
| AnimateDiff-SD1.5 | 06/2023 | -5.21% | -60.09% | 43.40% | 48.61% |
| AnimateDiff-SDXL | 04/2024 | -5.07% | -58.48% | 38.93% | 44.00% |
| LTX-Video-13B-0.9.8 | 07/2025 | -4.32% | -49.83% | 54.65% | 58.97% |
| Wan2.2-TI2V-5B | 07/2025 | -2.12% | -24.45% | 50.90% | 53.02% |
| HunyuanVideo | 11/2025 | -0.29% | -3.34% | 51.15% | 51.44% |
| LTX-Video-2B-0.9.6 | 04/2025 | -0.20% | -2.31% | 57.95% | 58.15% |
| CogVideoX-2B | 08/2024 | 0.93% | 10.73% | 41.11% | 40.18% |
| Mochi-1-preview | 10/2024 | 3.85% | 44.41% | 49.11% | 45.26% |
| CogVideoX1.5-5B | 11/2024 | 4.85% | 55.94% | 48.46% | 43.61% |
| CogVideoX-5B | 08/2024 | 5.09% | 58.71% | 51.36% | 46.27% |
| Wan2.1-T2V-1.3B | 03/2025 | 5.36% | 61.82% | 46.92% | 41.56% |
| Wan2.2-T2V-A14B | 07/2025 | 5.51% | 63.55% | 55.73% | 50.22% |
| Wan2.1-T2V-14B | 03/2025 | 5.91% | 68.17% | 54.80% | 48.89% |
| Human | reference | 8.67% | 100.00% | 85.09% | 76.42% |
Table 5. Numerical CCI results. Wan2.1-T2V-14B has the best model CCI at 5.91%, still below the human 8.67% reference.
Aggregate Ranking And Cross-Metric Analysis
Because RSI is a prerequisite but not sufficient for causal cognition, the paper ranks models by summing RSI rank and CCI rank, breaking ties by RSI rank. Figure 9 is the aggregate view used for downstream correlations.
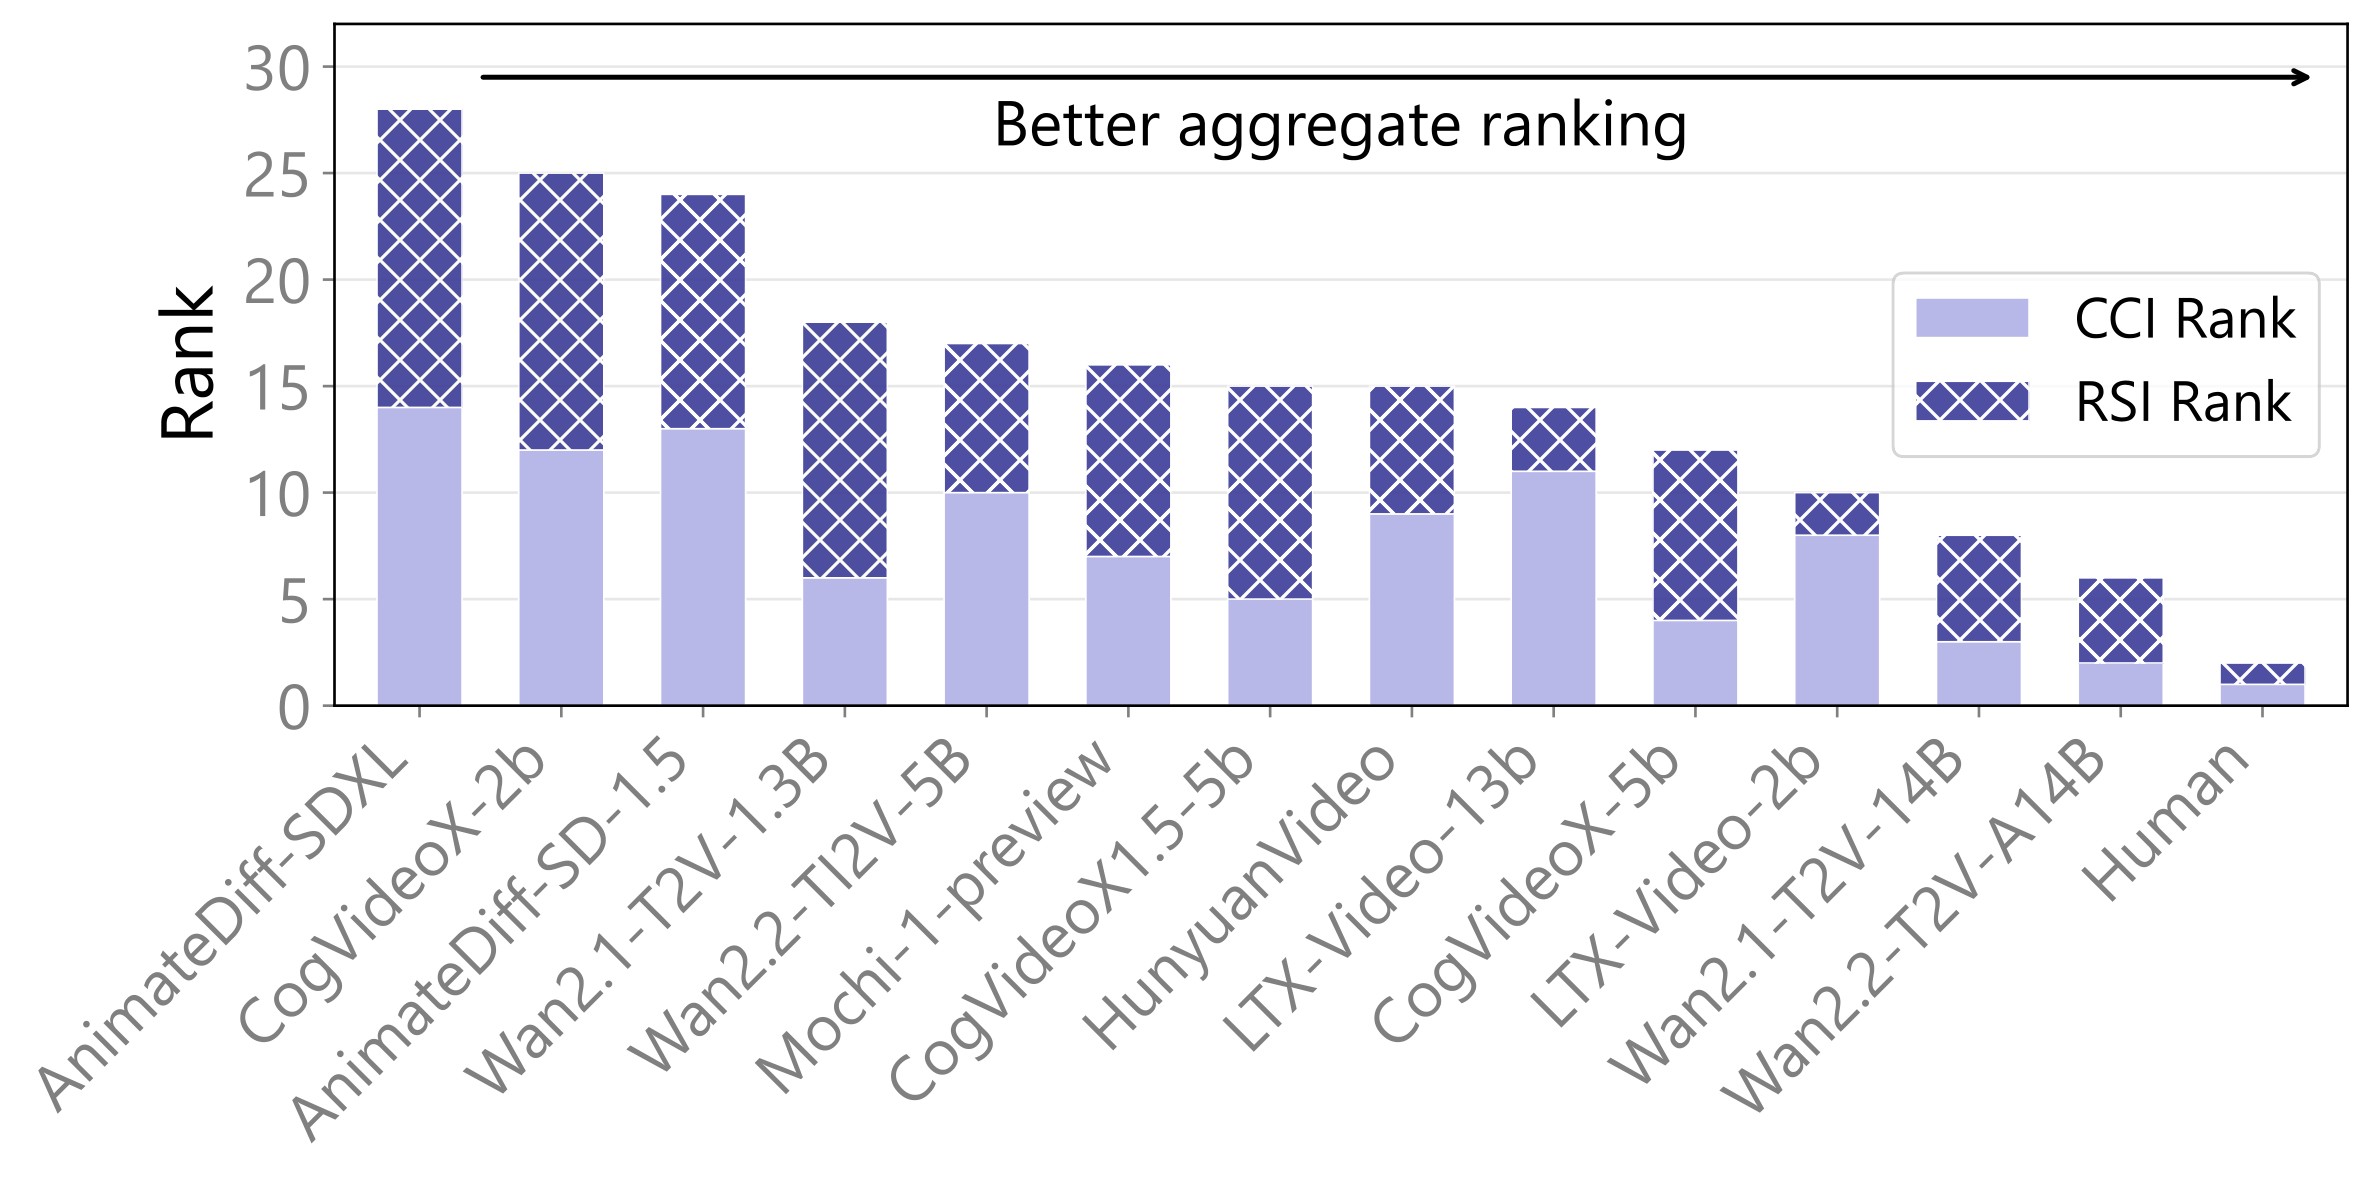
Table 6 is the key external validity result. The aggregate ranking correlates with LikePhys and with model release date/parameter count, but has zero correlation with VBench aesthetic quality.
| Comparison target | Kendall tau | p-value | Interpretation |
|---|---|---|---|
| Human preference | 0.3333 | 0.4694 | Directionally aligned but weak and non-significant in the reported study |
| LikePhys | 0.5111 | 0.0466 | Moderate significant relation to intuitive physics |
| VBench aesthetic quality | 0.0000 | 1.0000 | No evidence that prettier videos explain YoCausal ranking |
| VBench subject consistency | 0.3333 | 0.1289 | Weak/non-significant relation |
| VBench background consistency | 0.0256 | 0.9524 | No meaningful relation |
| VBench motion smoothness | 0.2821 | 0.2044 | Weak/non-significant relation |
| VBench temporal flickering | 0.2564 | 0.2519 | Weak/non-significant relation |
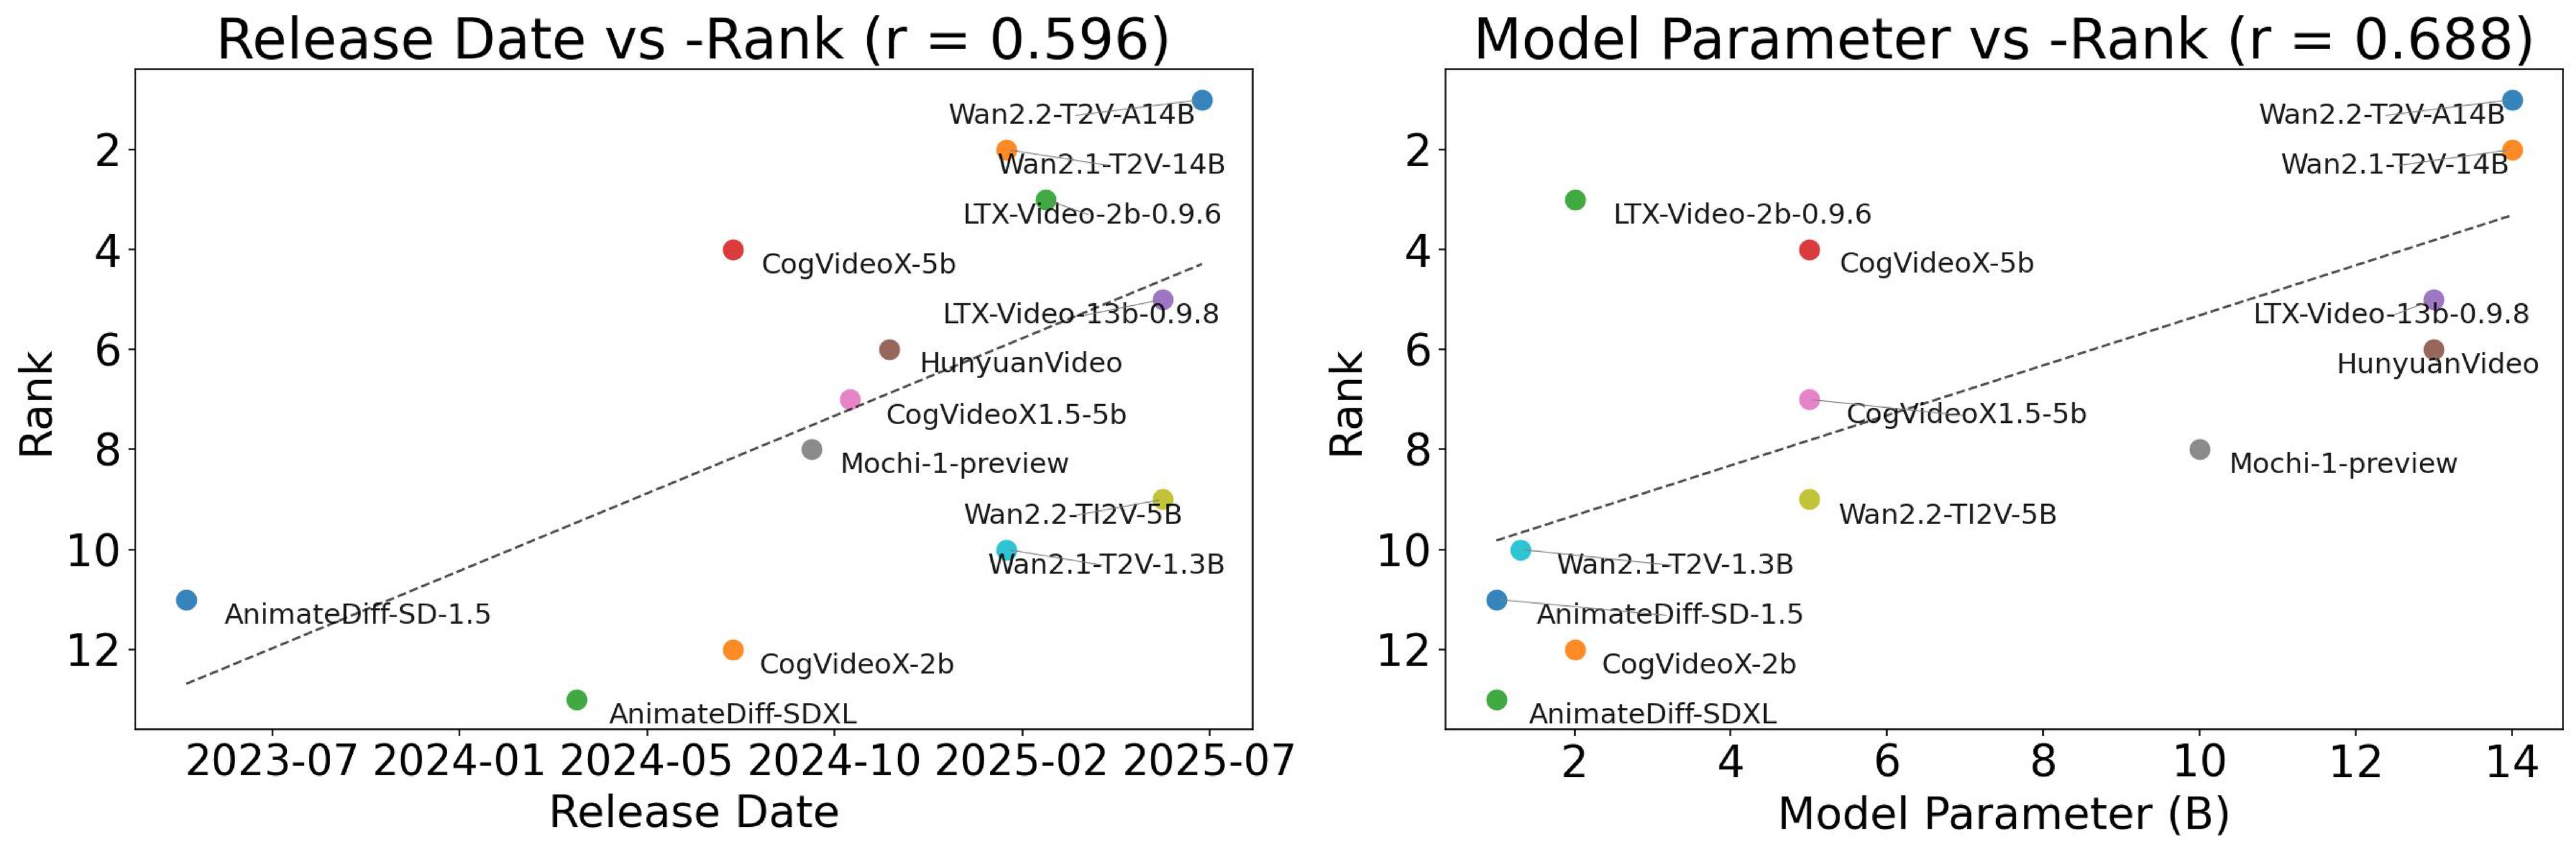
| Release date | 0.5958 | 0.0316 | Newer models tend to rank better |
| Number of parameters | 0.6880 | 0.0093 | Larger models tend to rank better |
Table 6. Cross-metric analysis. This supports the paper's claim that causal cognition overlaps with physics understanding and scaling, but is not simply visual quality.
The scaling plot in Figure 10 visualizes the release-date and parameter-count correlations.
Robustness Checks
The paper addresses two confounders. First, the forward text prompt might make the reversed video look mismatched. The null-prompt ablation in Table 7 is limited to three representative models but suggests that RSI/CCI structure remains close under null prompts.
| Metric | HunyuanVideo | CogVideoX-5B | LTX-Video-2B-0.9.6 |
|---|---|---|---|
| RSI with forward prompt | 52.05% | 49.92% | 58.86% |
| RSI with null prompt | 51.17% | 47.55% | 56.92% |
| CCI with forward prompt | -0.29% | 5.09% | 0.93% |
| CCI with null prompt | -2.95% | 6.17% | -0.30% |
Table 7. Null-prompt ablation. The pattern is similar under null prompt, but the ablation is smaller than the full 13-model benchmark.
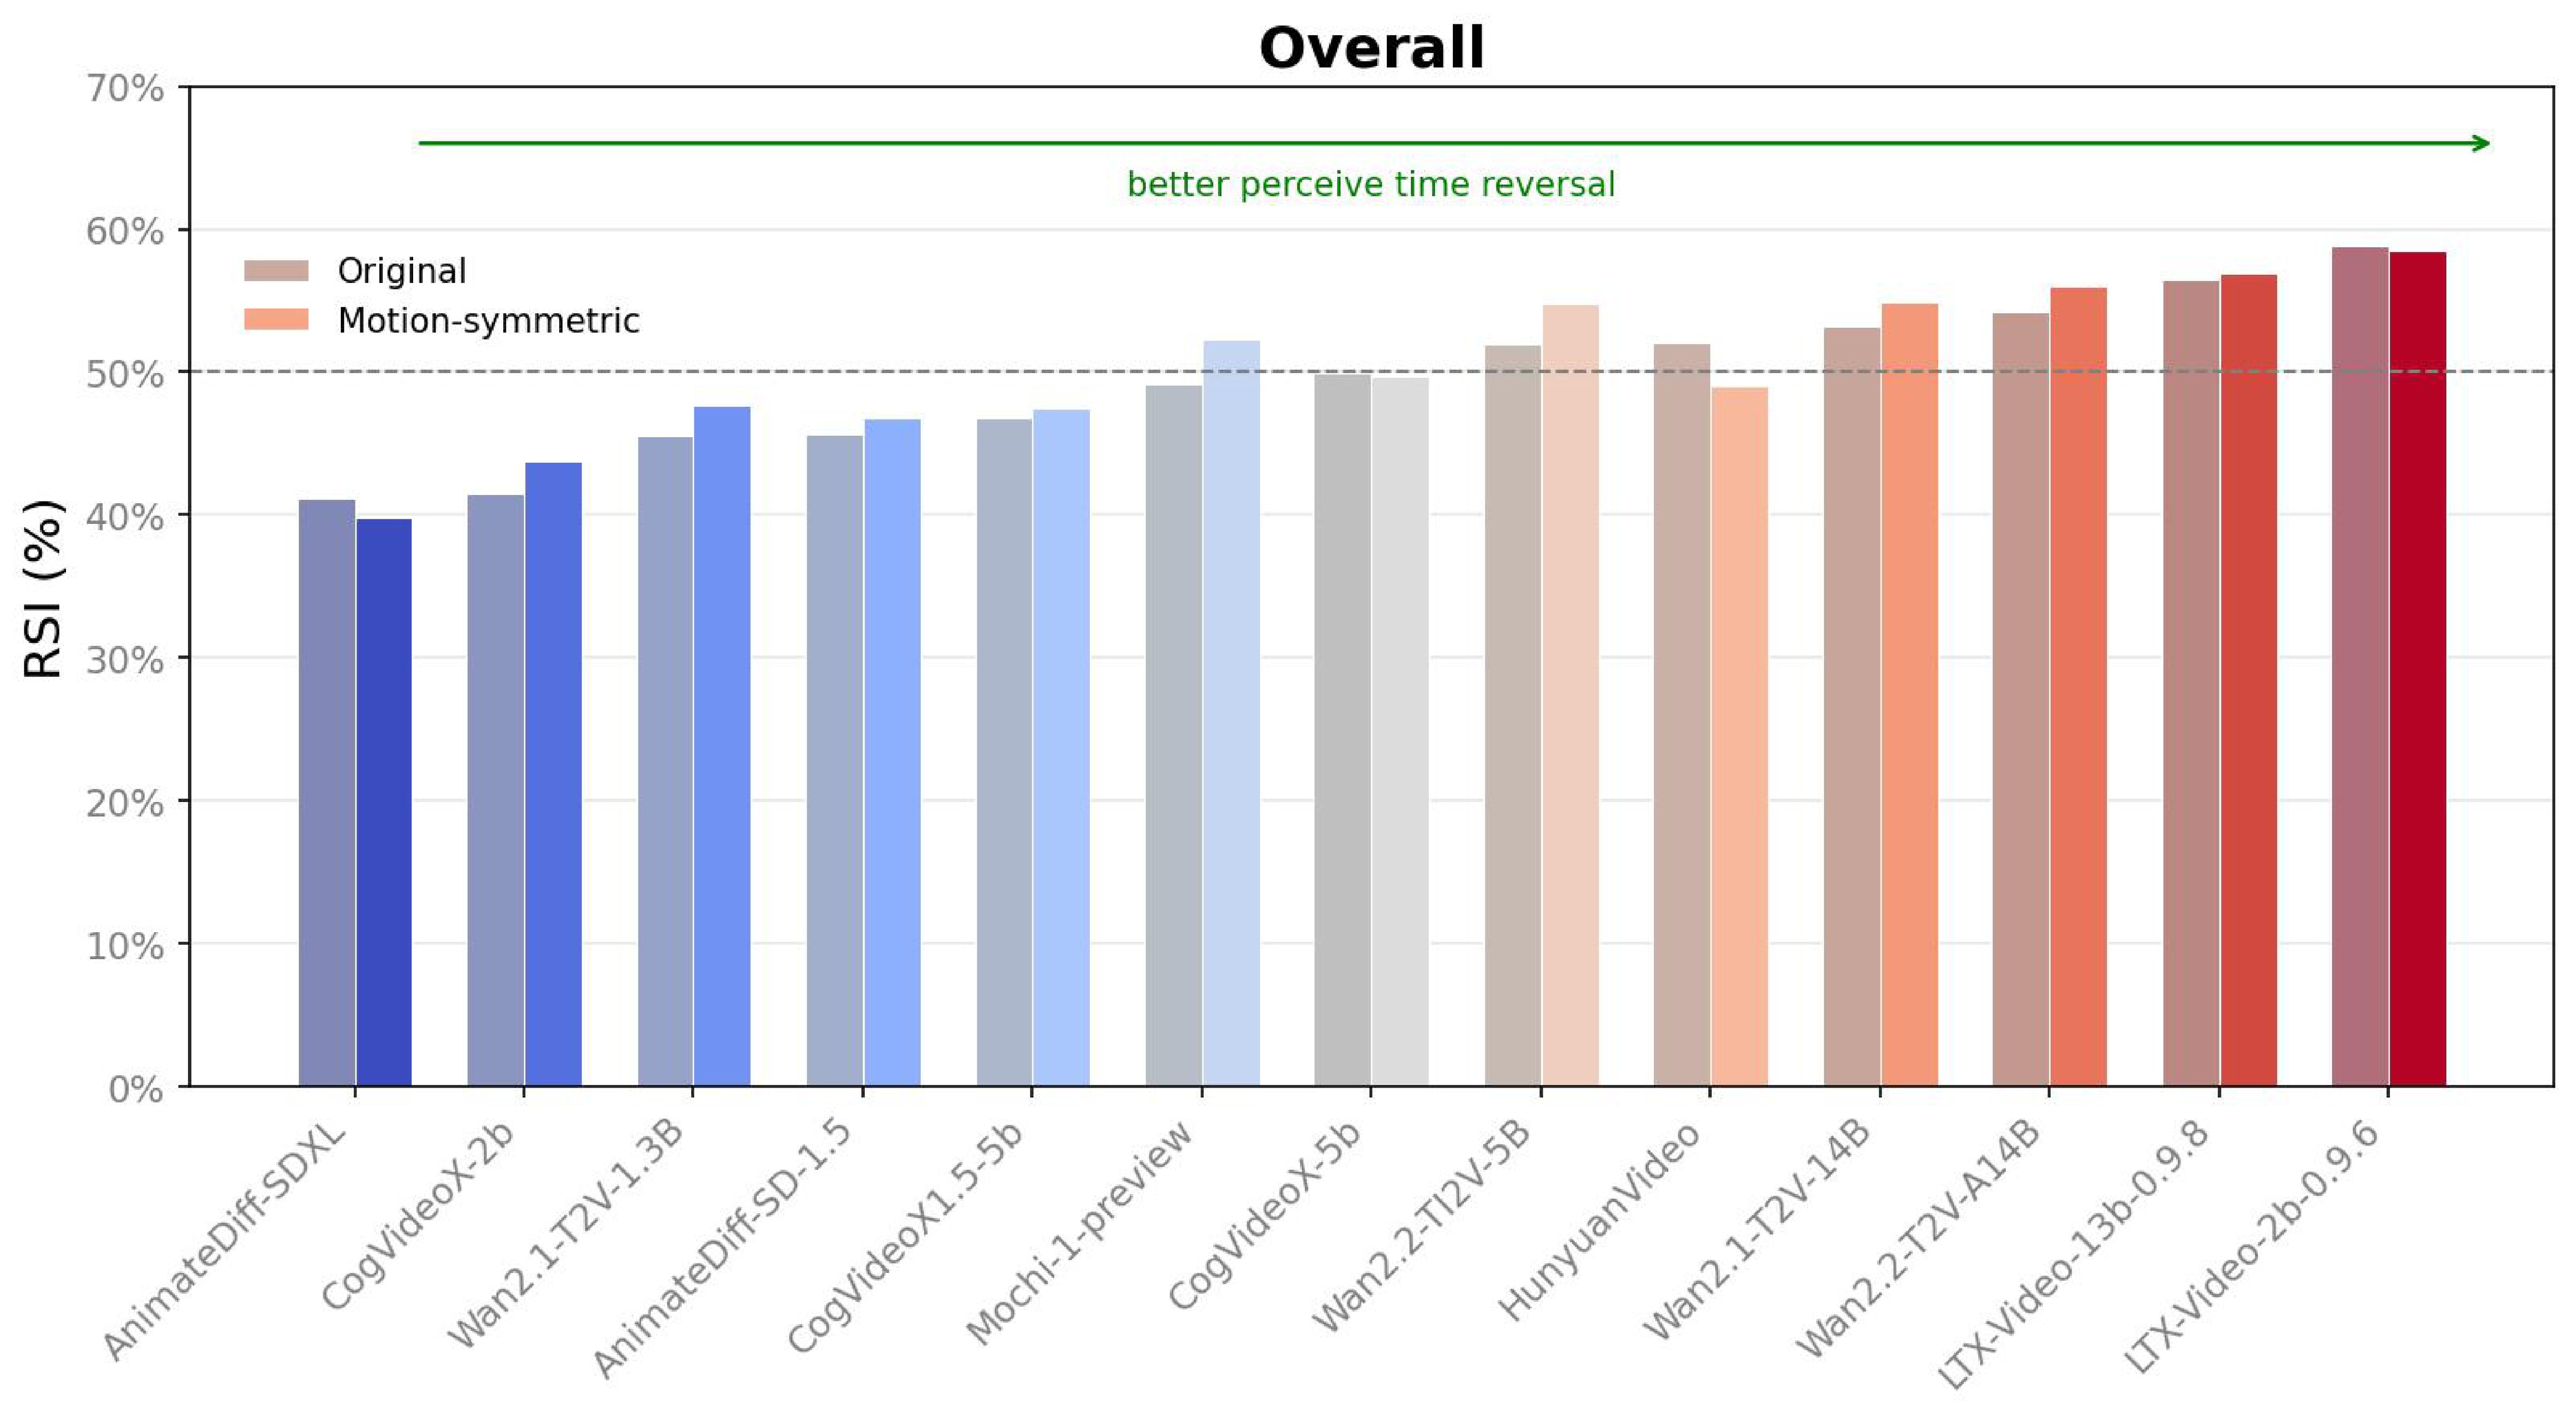
Second, reversed videos may differ in low-level motion entropy. Figure 11 compares original RSI against RSI on the 30% of videos with the most symmetric optical-flow magnitude trajectories.
Practical Takeaways
YoCausal is most reusable as an evaluation recipe: use real videos, build forward/reverse pairs, compute matched denoising losses, then report both RSI and CCI. RSI tells whether a model notices temporal direction; CCI asks whether causal scenes create more extra surprise than non-causal scenes.
The main result is not that current video diffusion models have no causal signal. Several models score above chance on RSI, and the best Wan/CogVideo variants obtain positive CCI. The stronger result is separation: some models with good arrow-of-time perception have weak causal separation, so "it knows videos go forward" is not the same as "it models cause and effect."
The VLM-based causal split is a pragmatic scaling device. The paper provides meaningful validation through VLM-human agreement, VLM sensitivity, and optical-flow checks, but a researcher using YoCausal for high-stakes model comparison should still audit the causal/non-causal labels for the target domain.
The biggest limitations are explicit in the paper: temporally symmetric events make RSI ineffective, and computing denoising losses requires model-weight access, so closed-source video generators cannot be externally evaluated unless their developers run the benchmark internally.