Source-first digest for checked paper rank 9, rank_id p013.
- Routing status:
success - PDF extraction: not used
Motivation / Background
The paper starts from a concrete failure mode in current VLMs: semantically identical text can produce different behavior depending on whether it is presented as tokens or rendered as an image. The authors call this carrier sensitivity. In the motivating experiment, the same questions are evaluated under normal text input and under a rendered-text-as-image protocol; accuracy drops for all four tested VLMs, including Qwen3.5-9B dropping from 68.95 to 60.25 and LLaVA-OV1.5-8B dropping from 53.52 to 41.84.
The paper argues that this is not just OCR weakness. It measures hidden-state distance between a text input and its rendered-image counterpart, then shows a monotonic relationship: samples in the closest distance bin lose 7.75 points, while samples in the farthest bin lose 21.23 points. Figure 1 is the central motivation figure because it connects the observed accuracy drop, the pairwise cross-modal distance, and LoMo's claimed 14.2% reduction in average distance.
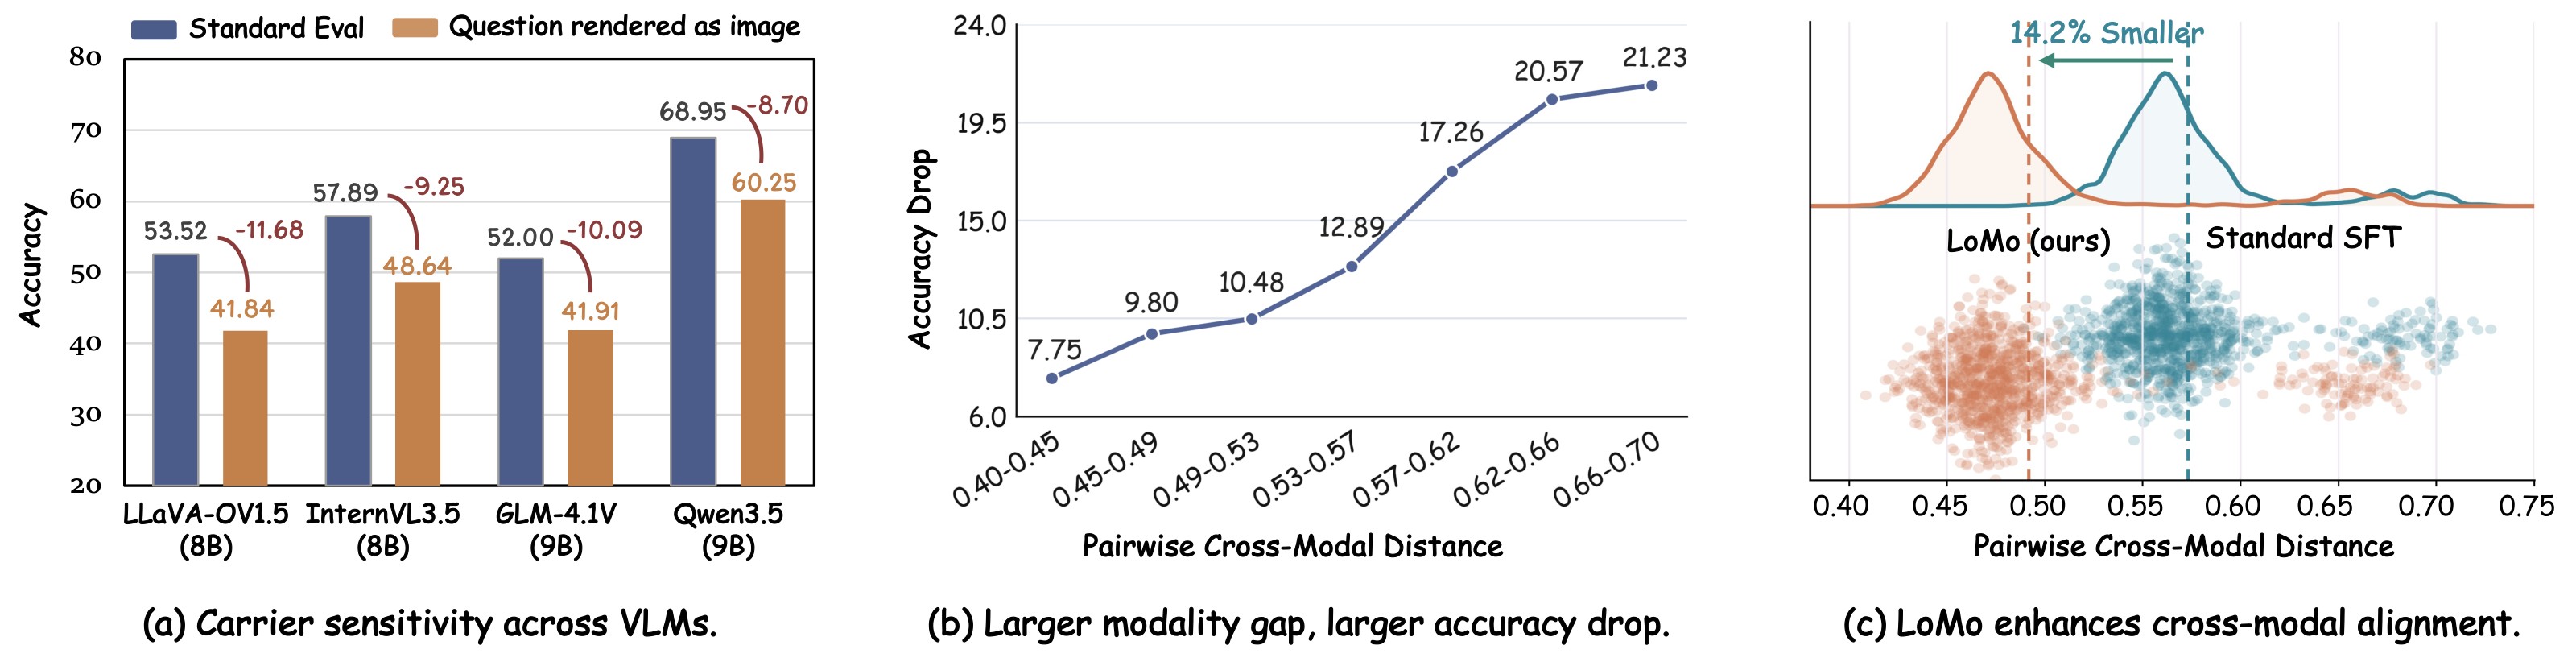
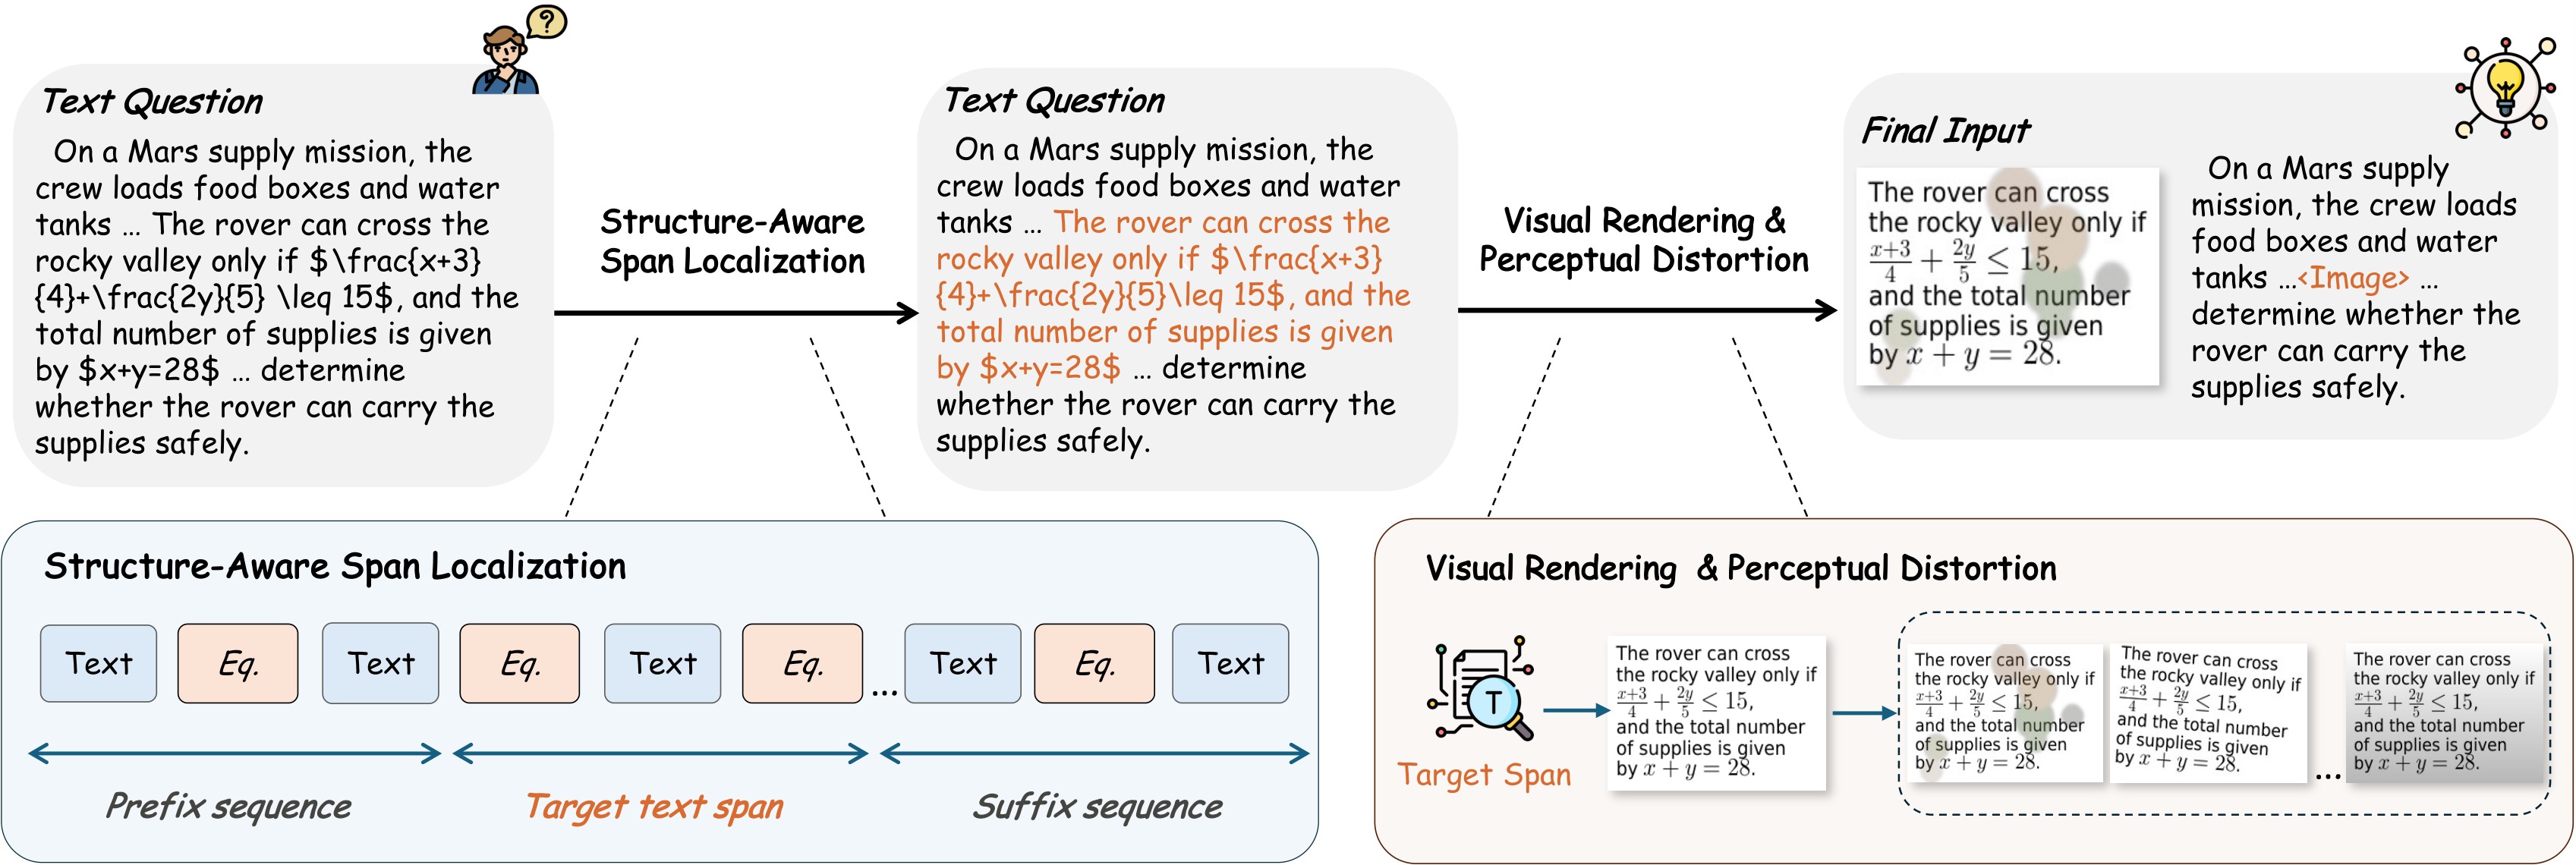
LoMo is the proposed data-side fix. Instead of changing the VLM architecture, it takes a text-only training example, renders a local span as an image, perturbs that image, and inserts it back into the surrounding text. The model must then answer from a text -> visual -> text input while the supervision target remains unchanged. The design is summarized in Figure 2.
Claims And Evidence
| Claim id | Main claim | Support | Evidence anchors |
|---|---|---|---|
| C1 | Carrier sensitivity is a systematic VLM failure mode and correlates with a measurable cross-carrier modality gap. | 4 | carrier sensitivity, rendered-evaluation results, alignment metrics |
| C2 | Local modality substitution gives cross-carrier supervision without architecture changes, extra annotations, or inference overhead. | 4 | LoMo transformation, method overview, training setup |
| C3 | LoMo improves standard multimodal benchmark accuracy across two backbones and 13 benchmarks. | 5 | main results, radar figure |
| C4 | LoMo is especially helpful when text is delivered through pixels, sharply reducing the rendered-evaluation degradation. | 5 | main results, carrier sensitivity figure |
| C5 | The middle-span interleaving structure and perceptual distortion are meaningful design choices rather than incidental details. | 4 | component ablation, rewrite ratio, rendering position |
| C6 | The gain is not merely due to increasing the number of image-bearing training samples. | 4 | matched image:text ratio |
| C7 | LoMo does not substantially damage pure-text abilities in the reported setup, but the evidence is bounded by model families and training-scale choices. | 3 | pure-text sanity check, limitations |
| C8 | LoMo improves internal cross-modal alignment metrics alongside task accuracy. | 4 | alignment decomposition, data-scale figure |
Scores are support-from-paper scores, not independent reproduction scores. C1 is capped at 4 because the distance analysis is correlational even though the trend is clean. C7 is capped at 3 because the pure-text gains are small and one metric regresses.
Core Technical Idea
LoMo is a data transformation, not a new model. Given a text-only supervised example \((x, a)\), it selects a middle span \(x_{\text{mid}}\), renders that span into an image, applies a visual perturbation, and returns a mixed-carrier input whose answer is still \(a\).
The important supervision signal is that the target answer is unchanged, so the model must learn to treat a rendered local text span as a semantic continuation of the surrounding token text. Figure 2 makes the mechanism concrete: choose a coherent span, render it, optionally distort it, and insert it into the original position.
The paper also rewrites the SFT objective to expose the intended alignment pressure. Standard SFT optimizes:
LoMo instead optimizes the same answer under the transformed carrier:
Taking expectation over \(a \sim p_\theta(\cdot \mid x)\) turns the second term into a KL-style agreement pressure:
The claim is not that LoMo explicitly minimizes a separate KL loss in implementation. The claim is that training on semantically equivalent mixed-carrier inputs turns the ordinary answer loss into an implicit pressure for text and rendered-text carriers to agree.
Method Details
Span Localization, Rendering, And Distortion
LoMo's pipeline is intentionally simple:
1. If the prompt has at most three sentences, render the whole text as the target span. Otherwise, split the input with a formula-aware chunker. 2. Treat text and formula blocks as atomic units so equations are not cut in half:
3. Select the middle one-third of the block sequence as \(x_{\text{mid}}\), keeping prefix and suffix in text. 4. Render math spans with a LaTeX renderer and non-math spans with a text renderer. If LaTeX rendering fails, fall back to text rendering rather than dropping the sample. 5. Trim excess margins and sample one of Clean, Rotate, Blur, ShadowOrStain, or Wave as the final perceptual distortion.
The appendix algorithm can be summarized as:
Input: text-only instance (x, a)
If SentenceCount(x) <= 3:
  (x_pre, x_mid, x_suf) = (empty, x, empty)
Else:
  C = FormulaAwareChunk(x)
  (x_pre, x_mid, x_suf) = ExtractMiddle(C)
If ContainsMath(x_mid):
  I = LaTeXRender(x_mid), falling back to TextRender
Else:
  I = TextRender(x_mid)
I = TrimMargin(I)
I' = one of Clean, Rotate, Blur, ShadowOrStain, Wave
Return ((x_pre, I', x_suf), a)
Training Setup
The experiments use two open VLM backbones: LLaVA-OneVision-1.5-8B-Base and Qwen3.5-9B-Base. The training pool is the LLaVA-OneVision 1.5 SFT corpus: 2M multimodal instruction examples plus 2M text-only instruction examples. Standard SFT trains on the same 4M examples without rendering; LoMo renders 50% of the text-only examples and keeps the optimizer, learning-rate schedule, number of steps, and data scale matched.
Implementation details are conventional SFT rather than a new architecture: one node with 8 NVIDIA H200 GPUs, maximum sequence length 32,768, maximum image resolution 2,560,000 pixels, FlashAttention 2, bf16, DeepSpeed ZeRO Stage 1, sequence packing, AdamW, one epoch, frozen vision tower, and updates to the language model plus multimodal projector.
Evaluation Protocols And Metrics
The paper evaluates each benchmark two ways. Standard Evaluation uses the original image plus text question. Rendered Evaluation renders the whole question as an image and uses that rendered image in place of text. Because the linguistic content is identical, the rendered protocol isolates carrier sensitivity.
For internal alignment, the paper uses MIR as a set-level visual/text token distribution gap and a paired distance:
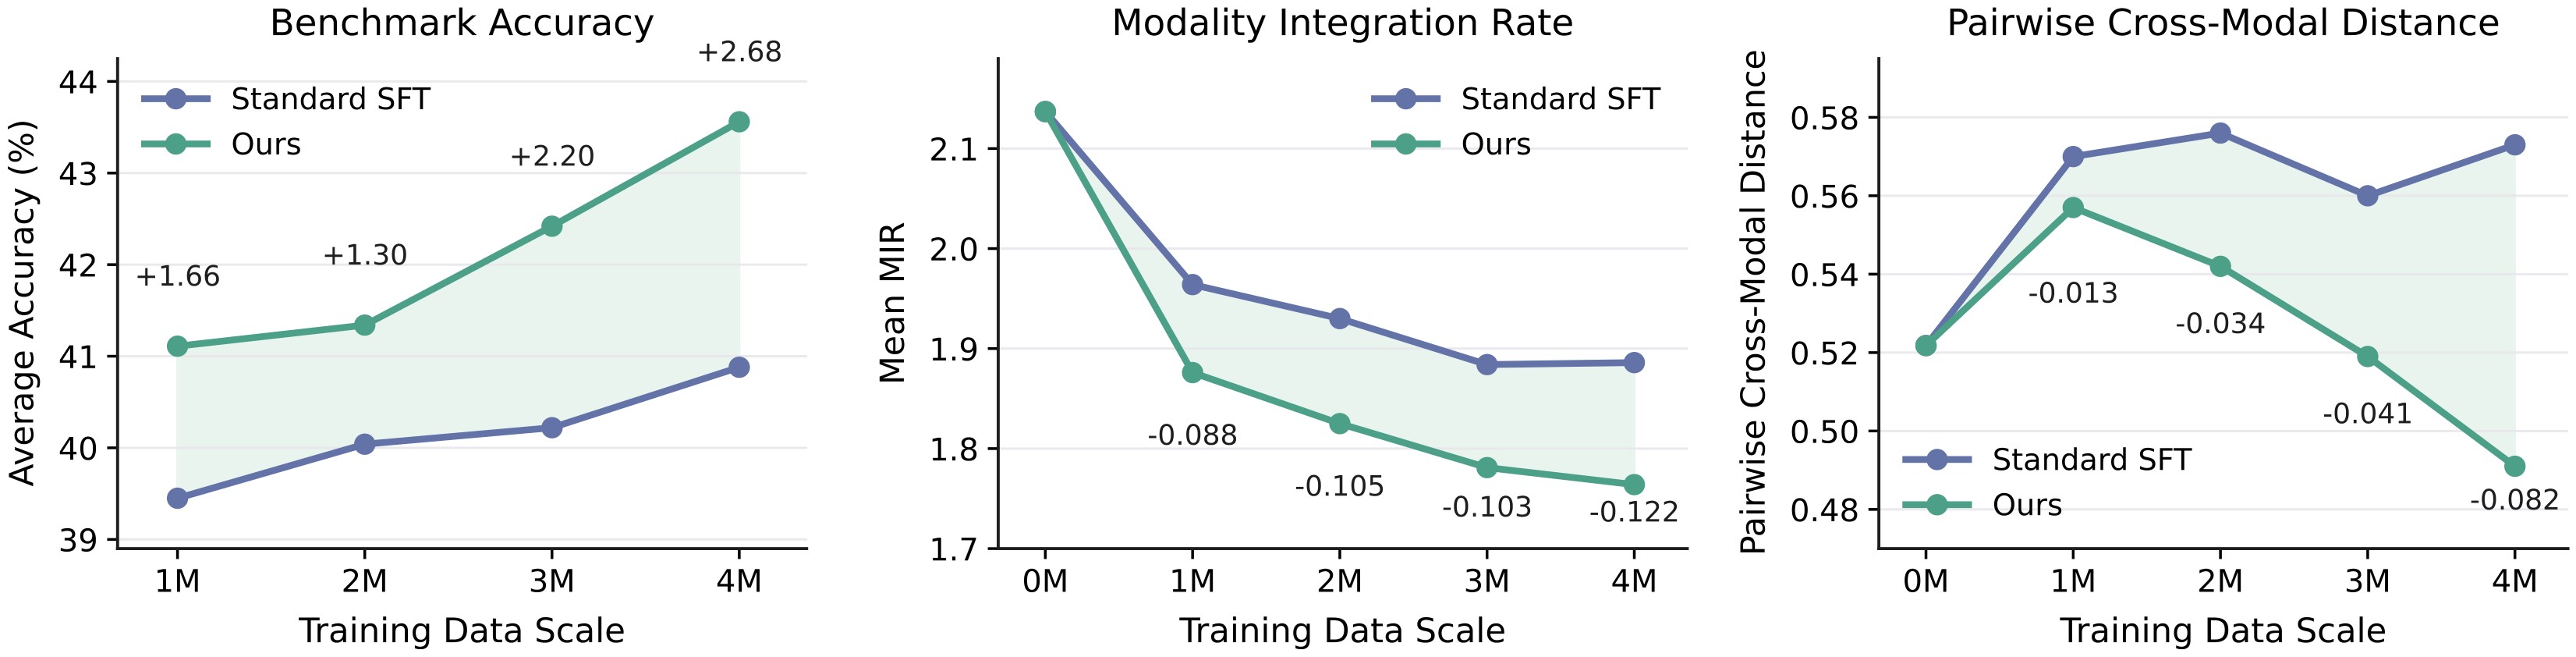
This metric is important because Figure 4 shows that LoMo improves both task accuracy and representation alignment as the data scale grows.
Experiments And Results
Main Benchmark Results
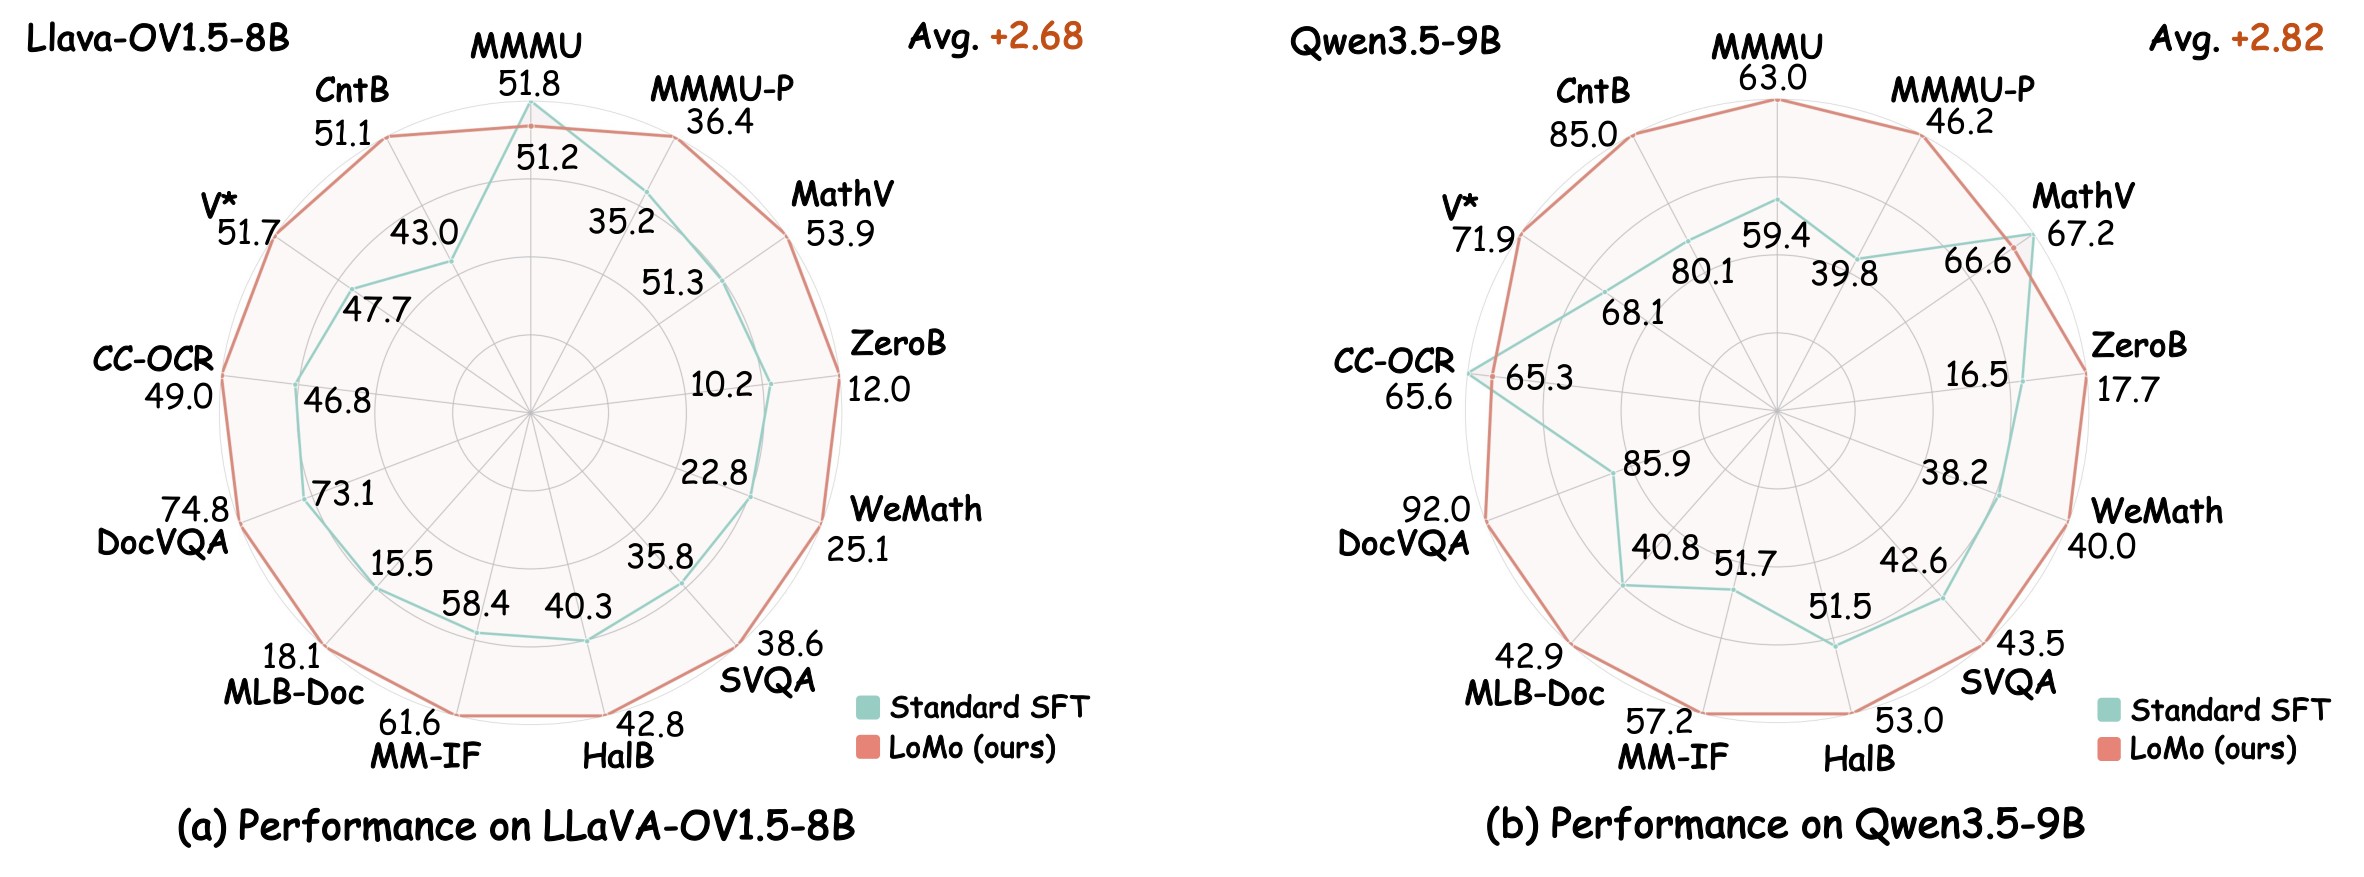
Table 1 is the main evidence for the paper's performance claims. Under Standard Evaluation, LoMo improves the average by +2.68 for LLaVA-OV1.5-8B and +2.82 for Qwen3.5-9B. Under Rendered Evaluation, the average gains grow to +18.86 and +11.92, respectively. This is the strongest support for the claim that LoMo specifically attacks carrier sensitivity.
Table 1. Main results across 13 multimodal benchmarks under two evaluation protocols. Original caption: Standard Evaluation feeds the original multimodal inputs (image + text question) to the model. Rendered Evaluation renders the entire text question as a single image. \(\Delta\) denotes the absolute change of LoMo over Standard SFT.
| Protocol | Model | Setting | MMMU | MMMU-P | MathV | ZeroB | WeMath | SVQA | HalB | MM-IF | MLB-Doc | DocVQA | CC-OCR | V* | CntB | Avg. |
|---|---|---|---|---|---|---|---|---|---|---|---|---|---|---|---|---|
| Standard | LLaVA-OV1.5-8B | Standard SFT | 51.78 | 35.24 | 51.30 | 10.18 | 22.76 | 35.51 | 40.35 | 58.40 | 15.49 | 73.05 | 46.76 | 47.71 | 42.97 | 40.88 |
| Standard | LLaVA-OV1.5-8B | + LoMo | 51.22 | 36.36 | 53.90 | 11.98 | 25.14 | 38.62 | 42.82 | 61.61 | 18.06 | 74.77 | 48.97 | 51.70 | 51.12 | 43.56 |
| Standard | LLaVA-OV1.5-8B | Delta | -0.56 | +1.12 | +2.60 | +1.80 | +2.38 | +3.11 | +2.47 | +3.21 | +2.57 | +1.72 | +2.21 | +3.99 | +8.15 | +2.68 |
| Standard | Qwen3.5-9B | Standard SFT | 59.44 | 39.83 | 67.20 | 16.54 | 38.19 | 42.57 | 51.53 | 51.74 | 40.79 | 85.89 | 65.61 | 68.13 | 80.08 | 54.43 |
| Standard | Qwen3.5-9B | + LoMo | 63.00 | 46.18 | 66.60 | 17.66 | 40.00 | 43.51 | 52.99 | 57.23 | 42.90 | 91.99 | 65.31 | 71.86 | 85.01 | 57.25 |
| Standard | Qwen3.5-9B | Delta | +3.56 | +6.35 | -0.60 | +1.12 | +1.81 | +0.94 | +1.46 | +5.49 | +2.11 | +6.10 | -0.30 | +3.73 | +4.93 | +2.82 |
| Rendered | LLaVA-OV1.5-8B | Standard SFT | 21.22 | 16.01 | 18.10 | 3.59 | 0.95 | 22.42 | 41.36 | 28.83 | 3.94 | 15.38 | 14.49 | 8.12 | 3.67 | 15.24 |
| Rendered | LLaVA-OV1.5-8B | + LoMo | 35.56 | 27.59 | 39.50 | 7.63 | 11.33 | 31.06 | 61.65 | 48.83 | 6.69 | 58.89 | 39.89 | 36.13 | 38.49 | 34.10 |
| Rendered | LLaVA-OV1.5-8B | Delta | +14.34 | +11.58 | +21.40 | +4.04 | +10.38 | +8.64 | +20.29 | +20.00 | +2.75 | +43.51 | +25.40 | +28.01 | +34.82 | +18.86 |
| Rendered | Qwen3.5-9B | Standard SFT | 49.52 | 33.06 | 56.90 | 15.94 | 23.43 | 39.95 | 43.37 | 41.25 | 28.87 | 47.24 | 49.60 | 61.58 | 71.66 | 43.26 |
| Rendered | Qwen3.5-9B | + LoMo | 62.48 | 45.29 | 65.50 | 16.62 | 39.72 | 43.26 | 47.05 | 54.32 | 36.57 | 91.73 | 66.14 | 64.73 | 83.98 | 55.18 |
| Rendered | Qwen3.5-9B | Delta | +12.96 | +12.23 | +8.60 | +0.68 | +16.29 | +3.31 | +3.68 | +13.07 | +7.70 | +44.49 | +16.54 | +3.15 | +12.32 | +11.92 |
The radar figure gives the compact visual version of the Standard Evaluation results. It is useful because it shows that the average gain is not concentrated in a single category: LoMo improves most axes for both backbones, with small regressions on LLaVA MMMU and Qwen MathVista/CC-OCR.
Representation Alignment And Data Scale
Figure 4 is the main evidence that LoMo's benefits track alignment, not only downstream accuracy. At the 4M scale, LoMo's average accuracy gain reaches +2.68, MIR is 0.122 lower than Standard SFT, and paired cross-modal distance drops to 0.49 while Standard SFT rises to 0.57.
Component Ablations
Table 2 separates the pieces of LoMo. Full-question rendering improves the average from 40.88 to 42.07, but LoMo without perceptual distortion reaches 43.10 and full LoMo reaches 43.56. The paper's interpretation is that span localization and interleaving are the dominant ingredients, while perceptual distortion adds another smaller gain.
Table 2. Component ablation of LoMo on LLaVA-OV1.5-8B. Original caption: Full-Text Rendering renders the entire input as images without Structure-Aware Span Localization or Perceptual Distortion. PD: Perceptual Distortion.
| Method | MMMU | MMMU-P | MathV | ZeroB | WeMath | SVQA | HalB | MM-IF | MLB-Doc | DocVQA | CC-OCR | V* | CntB | Avg. |
|---|---|---|---|---|---|---|---|---|---|---|---|---|---|---|
| Standard SFT | 51.78 | 35.24 | 51.30 | 10.18 | 22.76 | 35.51 | 40.35 | 58.40 | 15.49 | 73.05 | 46.76 | 47.71 | 42.97 | 40.88 |
| + Full-Text Rendering | 50.56 | 35.53 | 55.90 | 11.68 | 22.76 | 35.60 | 39.45 | 59.51 | 16.87 | 71.80 | 47.35 | 47.32 | 52.55 | 42.07 |
| + LoMo w/o PD | 51.00 | 35.38 | 55.40 | 11.98 | 25.33 | 36.59 | 45.17 | 60.00 | 16.59 | 73.77 | 48.15 | 50.65 | 50.31 | 43.10 |
| + LoMo | 51.22 | 36.36 | 53.90 | 11.98 | 25.14 | 38.62 | 42.82 | 61.61 | 18.06 | 74.77 | 48.97 | 51.70 | 51.12 | 43.56 |
Rewrite Ratio, Position, And Matched Exposure
Table 3 shows that rewriting some text-only data is consistently useful, but rewriting all of it is not best. The average peaks at a 50% rewrite ratio, 43.56, then falls to 42.68 at 100%, suggesting that LoMo needs a mixed diet of normal text and interleaved text-image examples.
Table 3. Quantitative results of different rewrite ratios on LLaVA-OV1.5-8B. Original caption: The rewrite ratio controls the fraction of text-only training samples reformatted into text-image interleaved sequences with LoMo. \(\Delta\) denotes the average improvement over the Standard SFT baseline.
| Setting | Rewrite ratio | MMMU | MMMU-P | MathV | ZeroB | WeMath | SVQA | HalB | MM-IF | MLB-Doc | DocVQA | CC-OCR | V* | CntB | Avg. | Delta |
|---|---|---|---|---|---|---|---|---|---|---|---|---|---|---|---|---|
| Standard SFT | 0% | 51.78 | 35.24 | 51.30 | 10.18 | 22.76 | 35.51 | 40.35 | 58.40 | 15.49 | 73.05 | 46.76 | 47.71 | 42.97 | 40.88 | -- |
| LoMo | 25% | 50.44 | 37.19 | 51.60 | 12.13 | 24.67 | 37.33 | 42.84 | 62.58 | 17.14 | 74.52 | 49.84 | 51.18 | 46.24 | 42.90 | +2.02 |
| LoMo | 50% | 51.22 | 36.36 | 53.90 | 11.98 | 25.14 | 38.62 | 42.82 | 61.61 | 18.06 | 74.77 | 48.97 | 51.70 | 51.12 | 43.56 | +2.68 |
| LoMo | 75% | 50.56 | 36.13 | 52.40 | 13.62 | 27.14 | 37.23 | 44.25 | 61.22 | 17.51 | 74.74 | 49.19 | 49.08 | 49.03 | 43.24 | +2.36 |
| LoMo | 100% | 50.67 | 36.32 | 53.80 | 11.23 | 26.38 | 37.63 | 41.37 | 61.07 | 17.14 | 74.77 | 48.23 | 50.07 | 46.18 | 42.68 | +1.80 |
Table 4 tests where the rendered span should sit. Middle placement is best at 43.56; prefix, suffix, and multi-span are all lower. This supports the method rationale that a text-image-text structure forces fusion between visual and textual carriers.
Table 4. Quantitative results of different rendering positions on LLaVA-OV1.5-8B. Original caption: Prefix renders the first one-third of the prompt, Middle renders the central one-third, Suffix renders the last one-third, and Multi-Span renders two short spans.
| Setting | Position | MMMU | MMMU-P | MathV | ZeroB | WeMath | SVQA | HalB | MM-IF | MLB-Doc | DocVQA | CC-OCR | V* | CntB | Avg. | Delta |
|---|---|---|---|---|---|---|---|---|---|---|---|---|---|---|---|---|
| Standard SFT | -- | 51.78 | 35.24 | 51.30 | 10.18 | 22.76 | 35.51 | 40.35 | 58.40 | 15.49 | 73.05 | 46.76 | 47.71 | 42.97 | 40.88 | -- |
| LoMo | Prefix | 52.89 | 36.49 | 53.50 | 11.83 | 24.00 | 35.85 | 40.75 | 59.06 | 15.77 | 74.60 | 47.98 | 51.70 | 47.21 | 42.44 | +1.56 |
| LoMo | Middle | 51.22 | 36.36 | 53.90 | 11.98 | 25.14 | 38.62 | 42.82 | 61.61 | 18.06 | 74.77 | 48.97 | 51.70 | 51.12 | 43.56 | +2.68 |
| LoMo | Suffix | 50.78 | 36.71 | 52.10 | 10.63 | 26.10 | 37.58 | 40.20 | 60.64 | 15.12 | 75.58 | 49.59 | 49.93 | 45.29 | 42.33 | +1.45 |
| LoMo | Multi-Span | 50.89 | 37.22 | 55.00 | 10.48 | 24.57 | 37.48 | 41.49 | 62.01 | 16.32 | 75.30 | 49.72 | 50.52 | 43.29 | 42.64 | +1.76 |
Table 5 addresses a potential confound: LoMo converts some text-only samples into image-bearing samples, so perhaps the benefit comes from more visual exposure. The matched 1:1 image:text comparison still gives +2.45 average points over Standard SFT, close to the original +2.68, so this concern is partially controlled.
Table 5. Controlled comparison under different image-bearing to text-only sample ratios on LLaVA-OV1.5-8B. Original caption: The original setting uses LoMo's natural 3:1 ratio after rewriting, while the matched setting controls the effective ratio back to 1:1 to match Standard SFT.
| Setting | Image:Text ratio | MMMU | MMMU-P | MathV | ZeroB | WeMath | SVQA | HalB | MM-IF | MLB-Doc | DocVQA | CC-OCR | V* | CntB | Avg. | Delta |
|---|---|---|---|---|---|---|---|---|---|---|---|---|---|---|---|---|
| Standard SFT | 1:1 | 51.78 | 35.24 | 51.30 | 10.18 | 22.76 | 35.51 | 40.35 | 58.40 | 15.49 | 73.05 | 46.76 | 47.71 | 42.97 | 40.88 | -- |
| LoMo | 3:1 Original | 51.22 | 36.36 | 53.90 | 11.98 | 25.14 | 38.62 | 42.82 | 61.61 | 18.06 | 74.77 | 48.97 | 51.70 | 51.12 | 43.56 | +2.68 |
| LoMo | 1:1 Matched | 51.44 | 36.24 | 51.40 | 12.57 | 24.86 | 38.27 | 43.70 | 62.10 | 18.88 | 74.02 | 48.37 | 51.57 | 49.97 | 43.33 | +2.45 |
Pure-Text Sanity Check
Table 6 is a narrow safety check. LoMo slightly improves the average on both backbones, +0.28 and +0.58, but the changes are small and not uniformly positive. The most important reading is "no obvious pure-text collapse" rather than a strong pure-text improvement claim.
Table 6. Pure-text capability sanity check. Original caption: Standard SFT and LoMo are evaluated on five pure-text benchmarks covering general knowledge, mathematical reasoning, code generation, and instruction following.
| Model | Setting | MMLU-Pro | HumanEval | LCB-V6 | GSM8K | IFEval | Avg. |
|---|---|---|---|---|---|---|---|
| LLaVA-OV1.5-8B | Standard SFT | 62.58 | 82.62 | 29.19 | 92.87 | 75.42 | 68.54 |
| LLaVA-OV1.5-8B | + LoMo | 62.27 | 82.93 | 29.91 | 93.40 | 75.60 | 68.82 |
| LLaVA-OV1.5-8B | Delta | -0.31 | +0.31 | +0.72 | +0.53 | +0.18 | +0.28 |
| Qwen3.5-9B | Standard SFT | 70.74 | 71.34 | 33.29 | 95.38 | 72.27 | 68.60 |
| Qwen3.5-9B | + LoMo | 71.16 | 71.95 | 33.43 | 94.54 | 74.86 | 69.19 |
| Qwen3.5-9B | Delta | +0.42 | +0.61 | +0.14 | -0.84 | +2.59 | +0.58 |
Practical Takeaways
- The most reusable idea is the data interface: convert part of a text-only instruction into a rendered, perturbed image while leaving the answer unchanged. This makes text-pixel equivalence part of the supervised task.
- The strongest empirical result is under Rendered Evaluation. The paper's Standard Evaluation gains are useful, but the much larger rendered gains show where LoMo is most targeted.
- The method is cheap at inference because it changes only training data. Its cost is in rendering and SFT data construction.
- The ablations argue against two weak explanations: full-text rendering is not enough, and a matched image:text ratio still improves. Middle local substitution appears to matter.
- The main limitation is scope. LoMo is validated only during SFT on two 8B-9B backbones; behavior during pretraining, RL post-training, and larger-model scaling is left open.
The paper's limitations section says LoMo is applied only during SFT, uses a block-level middle-span heuristic, and is evaluated under compute constraints on two backbones. Those caveats matter because the method is promising as a data recipe, but not yet shown as a universal pretraining or post-training principle.