Source-first digest for checked paper rank 39, rank_id p016.
- Routing status:
success - PDF extraction: not used
- Table recovery: malformed/empty converted tables were checked against
latex_flattened/main.flattened.tex
Motivation / Background
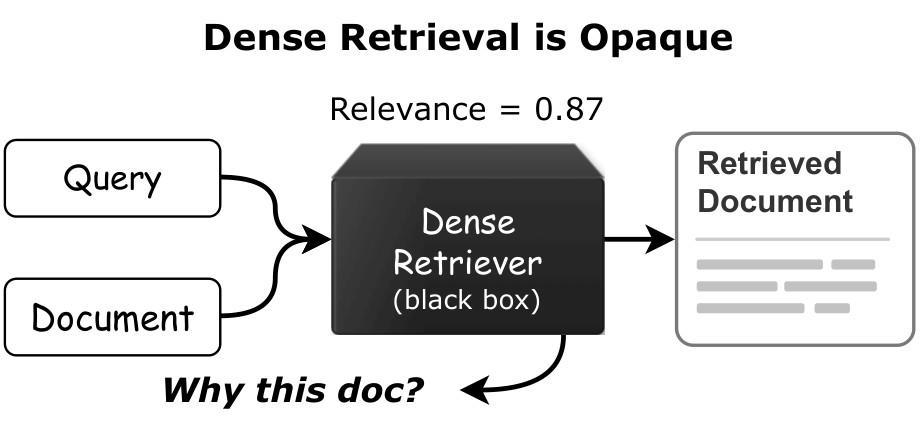
Dense retrievers rank documents by comparing high-dimensional query and document embeddings. That makes them effective, but it hides the reason a document scored highly: the system exposes a similarity value, not the latent factors that aligned the query and document. Figure 1 frames this opacity problem at the retrieval-result level.
Xetrieval attacks the problem at the embedding level. Instead of explaining results through only lexical overlap or a generated post-hoc rationale, it tries to decompose the same embedding space used by the retriever into sparse, named features. The overview in Figure 2 is the central map: a reasoning internalizer enriches document embeddings with CoT-like reasoning views, and a sparse autoencoder converts raw and reasoned embeddings into feature activations that can be shared, named, and intervened on.
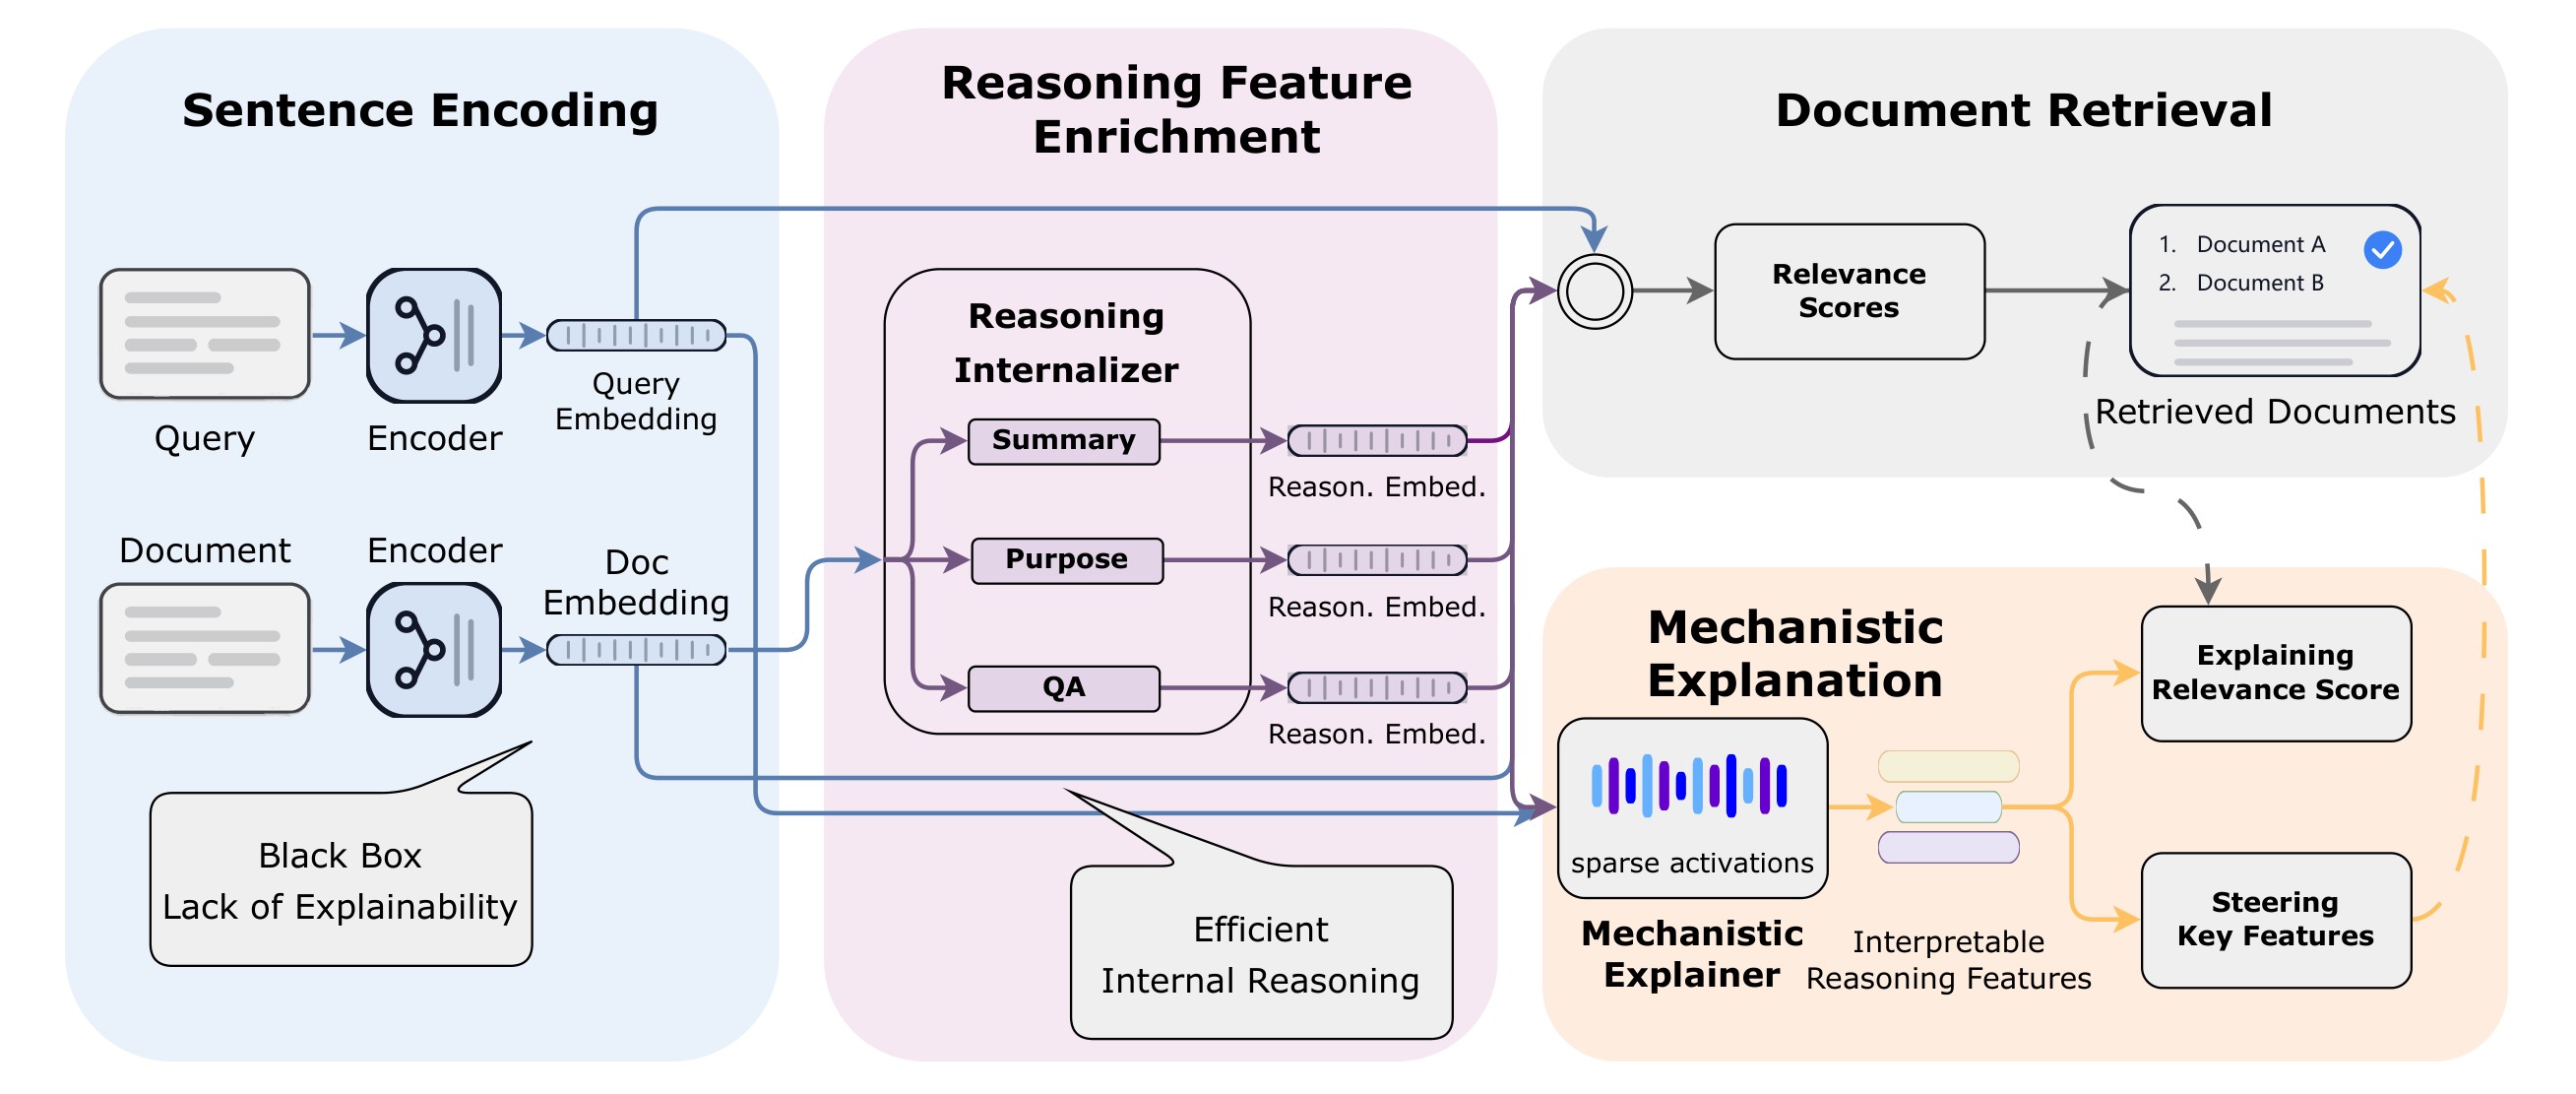
The key promise is not that Xetrieval explains an embedding model's internal neural circuitry. The paper is explicit that the analysis is limited to the sentence embedding output layer. The practical claim is narrower and still useful: for a query-document pair, Xetrieval can identify sparse features co-activated by the query and document-side views, attach short natural-language hypotheses to those features, and use feature interventions to test whether the selected directions matter for retrieval scores.
Claims And Evidence
| Claim id | Main claim | Support | Evidence anchors |
|---|---|---|---|
| C1 | Xetrieval gives embedding-level explanations of dense retrieval by decomposing query and document representations into shared sparse, human-readable factors. | 4 | framework overview, sparse explanation interface, feature explanation examples |
| C2 | The reasoning internalizer approximates CoT-enhanced document representations with a single feed-forward pass and usually recovers useful retrieval gains without autoregressive CoT generation. | 4 | internalizer objective, main NDCG table, efficiency figure |
| C3 | Reasoning-enriched embeddings are easier for the mechanistic explainer to decompose into useful sparse features than raw embeddings. | 4 | reasoning comparison, detection score distribution, SAE trade-off |
| C4 | TopK SAE at the reported sparsity setting is a reasonable explainer backbone because it balances reconstruction quality, mono-semanticity, and retrieval retention. | 4 | SAE trade-off, SAE training details |
| C5 | Xetrieval explanations are computationally practical compared with explicit CoT reasoning while staying competitive with CoT-enhanced retrieval on the reported scaling comparison. | 4 | efficiency figure, main NDCG table |
| C6 | The selected features are not only descriptive: erasing, retaining, amplifying, or suppressing them changes similarity scores and retrieval performance more strongly than baseline feature sets. | 4 | pair-level attribution, task-level steering, intervention details |
| C7 | The experimental evidence spans several retrieval tasks and retriever families, but the strongest numeric support is still based on sampled benchmark subsets and selected main-text retrievers. | 3 | benchmark statistics, main NDCG table, limitations |
| C8 | The paper's "mechanistic" scope is embedding-level rather than full circuit-level interpretability. | 5 | limitations |
Scores are support-from-paper scores, not independent reproduction scores. I cap broad deployment and mechanism claims below 5 when the evidence is convincing but limited by sampled corpora, output-layer analysis, or figure-only quantitative details.
Core Technical Idea
Xetrieval starts from a standard dense retrieval setup. A query encoder and document encoder produce embeddings:
The retriever scores relevance with a dot product or cosine similarity:
The explainer then maps the query and document-side representations into sparse codes:
Feature activations are thresholded:
The local explanation is the set of jointly active features:
Here \(h_j\) is the natural-language hypothesis attached to feature \(j\). This is why the paper calls the explanation embedding-level: the explanation is derived from sparse factors in the retrieval representation space, not from token-level attention or a separately generated rationale.
The second move is to enrich the document side with reasoning views. For each aspect \(t\in\{\textsc{Summary},\textsc{Purpose},\textsc{QA}\}\), a one-hidden-layer MLP maps a raw sentence embedding to a reasoning-enhanced embedding:
It is trained with MSE against embeddings of LLM-generated reasoning texts:
At explanation time, the document is represented by multiple views:
Xetrieval then aggregates query-overlap features across those views:
This view aggregation is the technical difference between direct sparse decomposition and Xetrieval. Direct decomposition only sees raw query and document embeddings; Xetrieval can expose relevance factors that are weak in the original document representation but salient after summary, purpose, or QA reasoning internalization.
Method Details
Training Data And Evaluation Scope
The reasoning internalizer is trained on StackExchange-derived documents. Table 1 shows the training-domain mix: 11,796 documents across politics, math, programming, science, robotics, economics, philosophy, sustainability, and related communities. The paper uses this corpus to generate aspect-specific teacher texts, embeds those texts with the same retriever, and trains three MLP internalizers for summary, purpose, and QA.
| Community | Docs | Community | Docs |
|---|---|---|---|
| politics | 1,000 | mathematica | 1,000 |
| codereview | 600 | economics | 600 |
| cs | 600 | chemistry | 600 |
| StackOverflow | 600 | ai | 600 |
| bioinformatics | 600 | codegolf | 600 |
| math | 600 | robotics | 600 |
| earthscience | 600 | mathoverflow | 600 |
| biology | 600 | philosophy | 600 |
| software-engineering | 600 | sustainability | 432 |
| computergraphics | 364 | ||
| Total | 11,796 |
Table 1. Reasoning-internalizer training domains. This table is recovered from main.flattened.tex because the Markdown table was malformed. It matters because the paper's reasoning views are not trained on one narrow domain.
Table 2 gives the sampled benchmark sizes used for retrieval evaluation. The main metric is NDCG@10.
| Dataset | Queries | Documents |
|---|---|---|
| BRIGHT | 1,384 | 12,000 |
| NQ | 8,383 | 8,383 |
| MuTual | 846 | 3,542 |
| TREC-NEWS | 57 | 9,968 |
| Signal-1M | 97 | 10,000 |
| Robust04 | 249 | 15,790 |
| ArguAna | 1,406 | 8,674 |
Table 2. Sampled benchmark statistics. This table is included because it bounds the scale and task diversity behind the reported retrieval gains.
Mechanistic Explainer
The mechanistic explainer is a sparse autoencoder. Given an embedding \(\mathbf{x}\), the SAE encoder creates a sparse code and the decoder reconstructs the embedding:
The columns of \(W\) act as learned feature directions. The training objective combines reconstruction and sparsity:
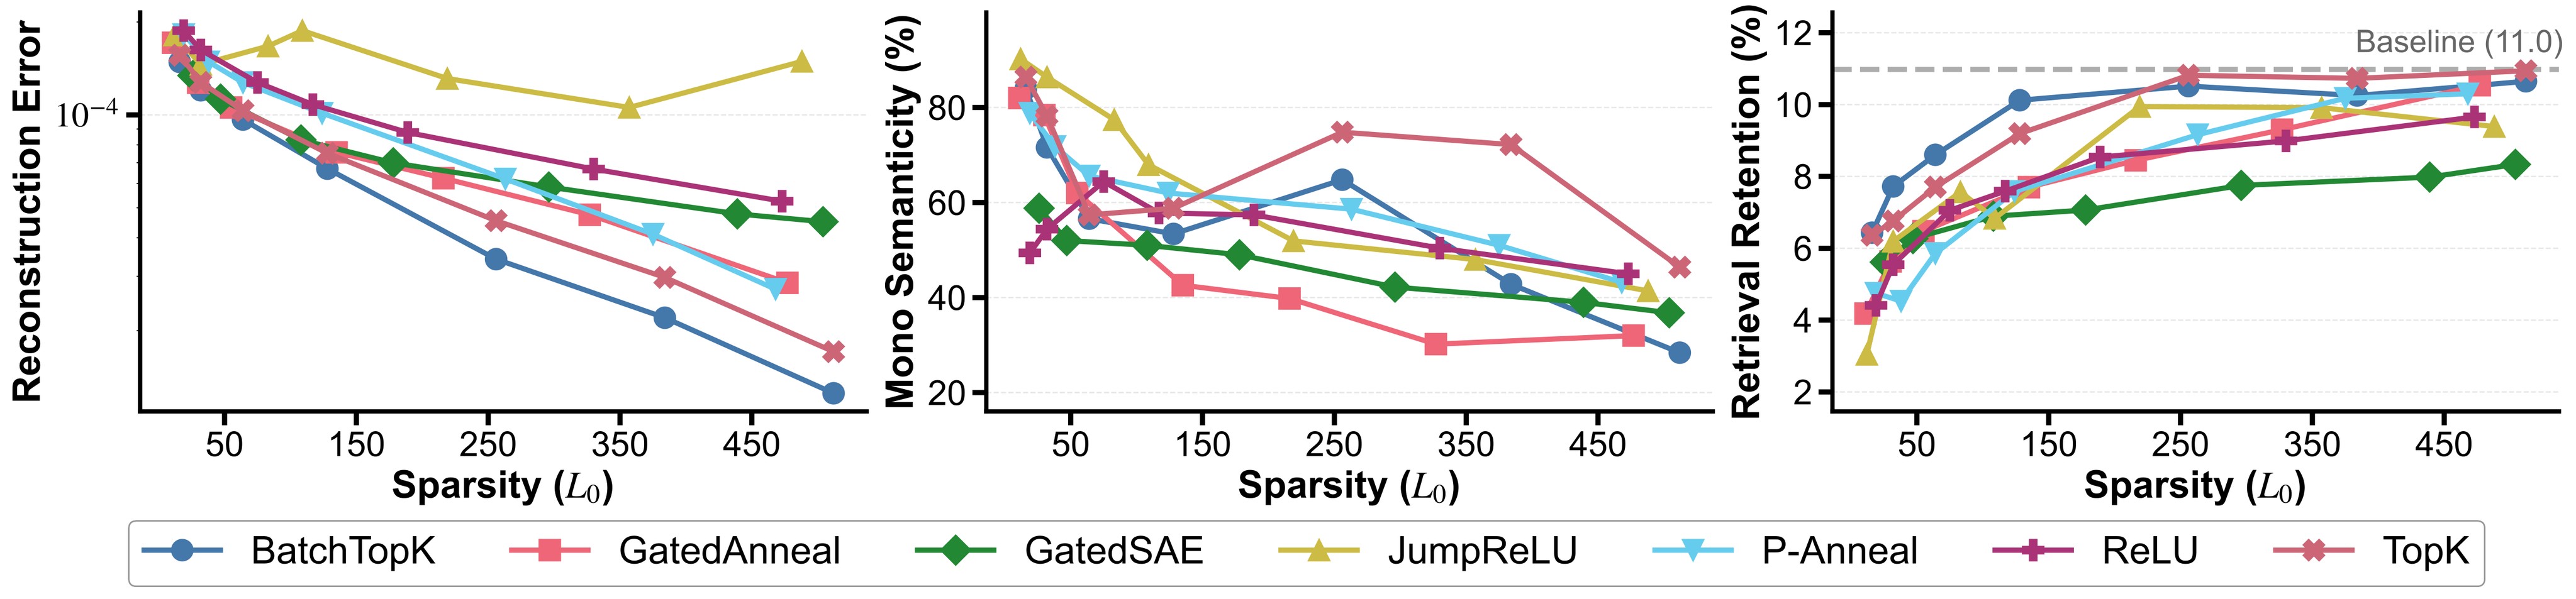
The paper evaluates ReLU, TopK, BatchTopK, Gated, JumpReLU, P-Annealing, and GatedAnnealing SAE variants. The trade-off in Figure 3 is central: lower sparsity gives cleaner mono-semantic features but worse reconstruction and retrieval retention, while higher active-feature counts recover more retrieval behavior at the cost of interpretability. The authors choose TopK with \(k=256\).
Feature Naming And Quality Checks
Feature descriptions are generated by taking top-activating samples for a sparse feature and asking an LLM to summarize the common semantic pattern into a short hypothesis. The paper evaluates these hypotheses with an intruder-detection style Detection Score: an LLM receives activating and non-activating examples and judges whether each conforms to the feature hypothesis.
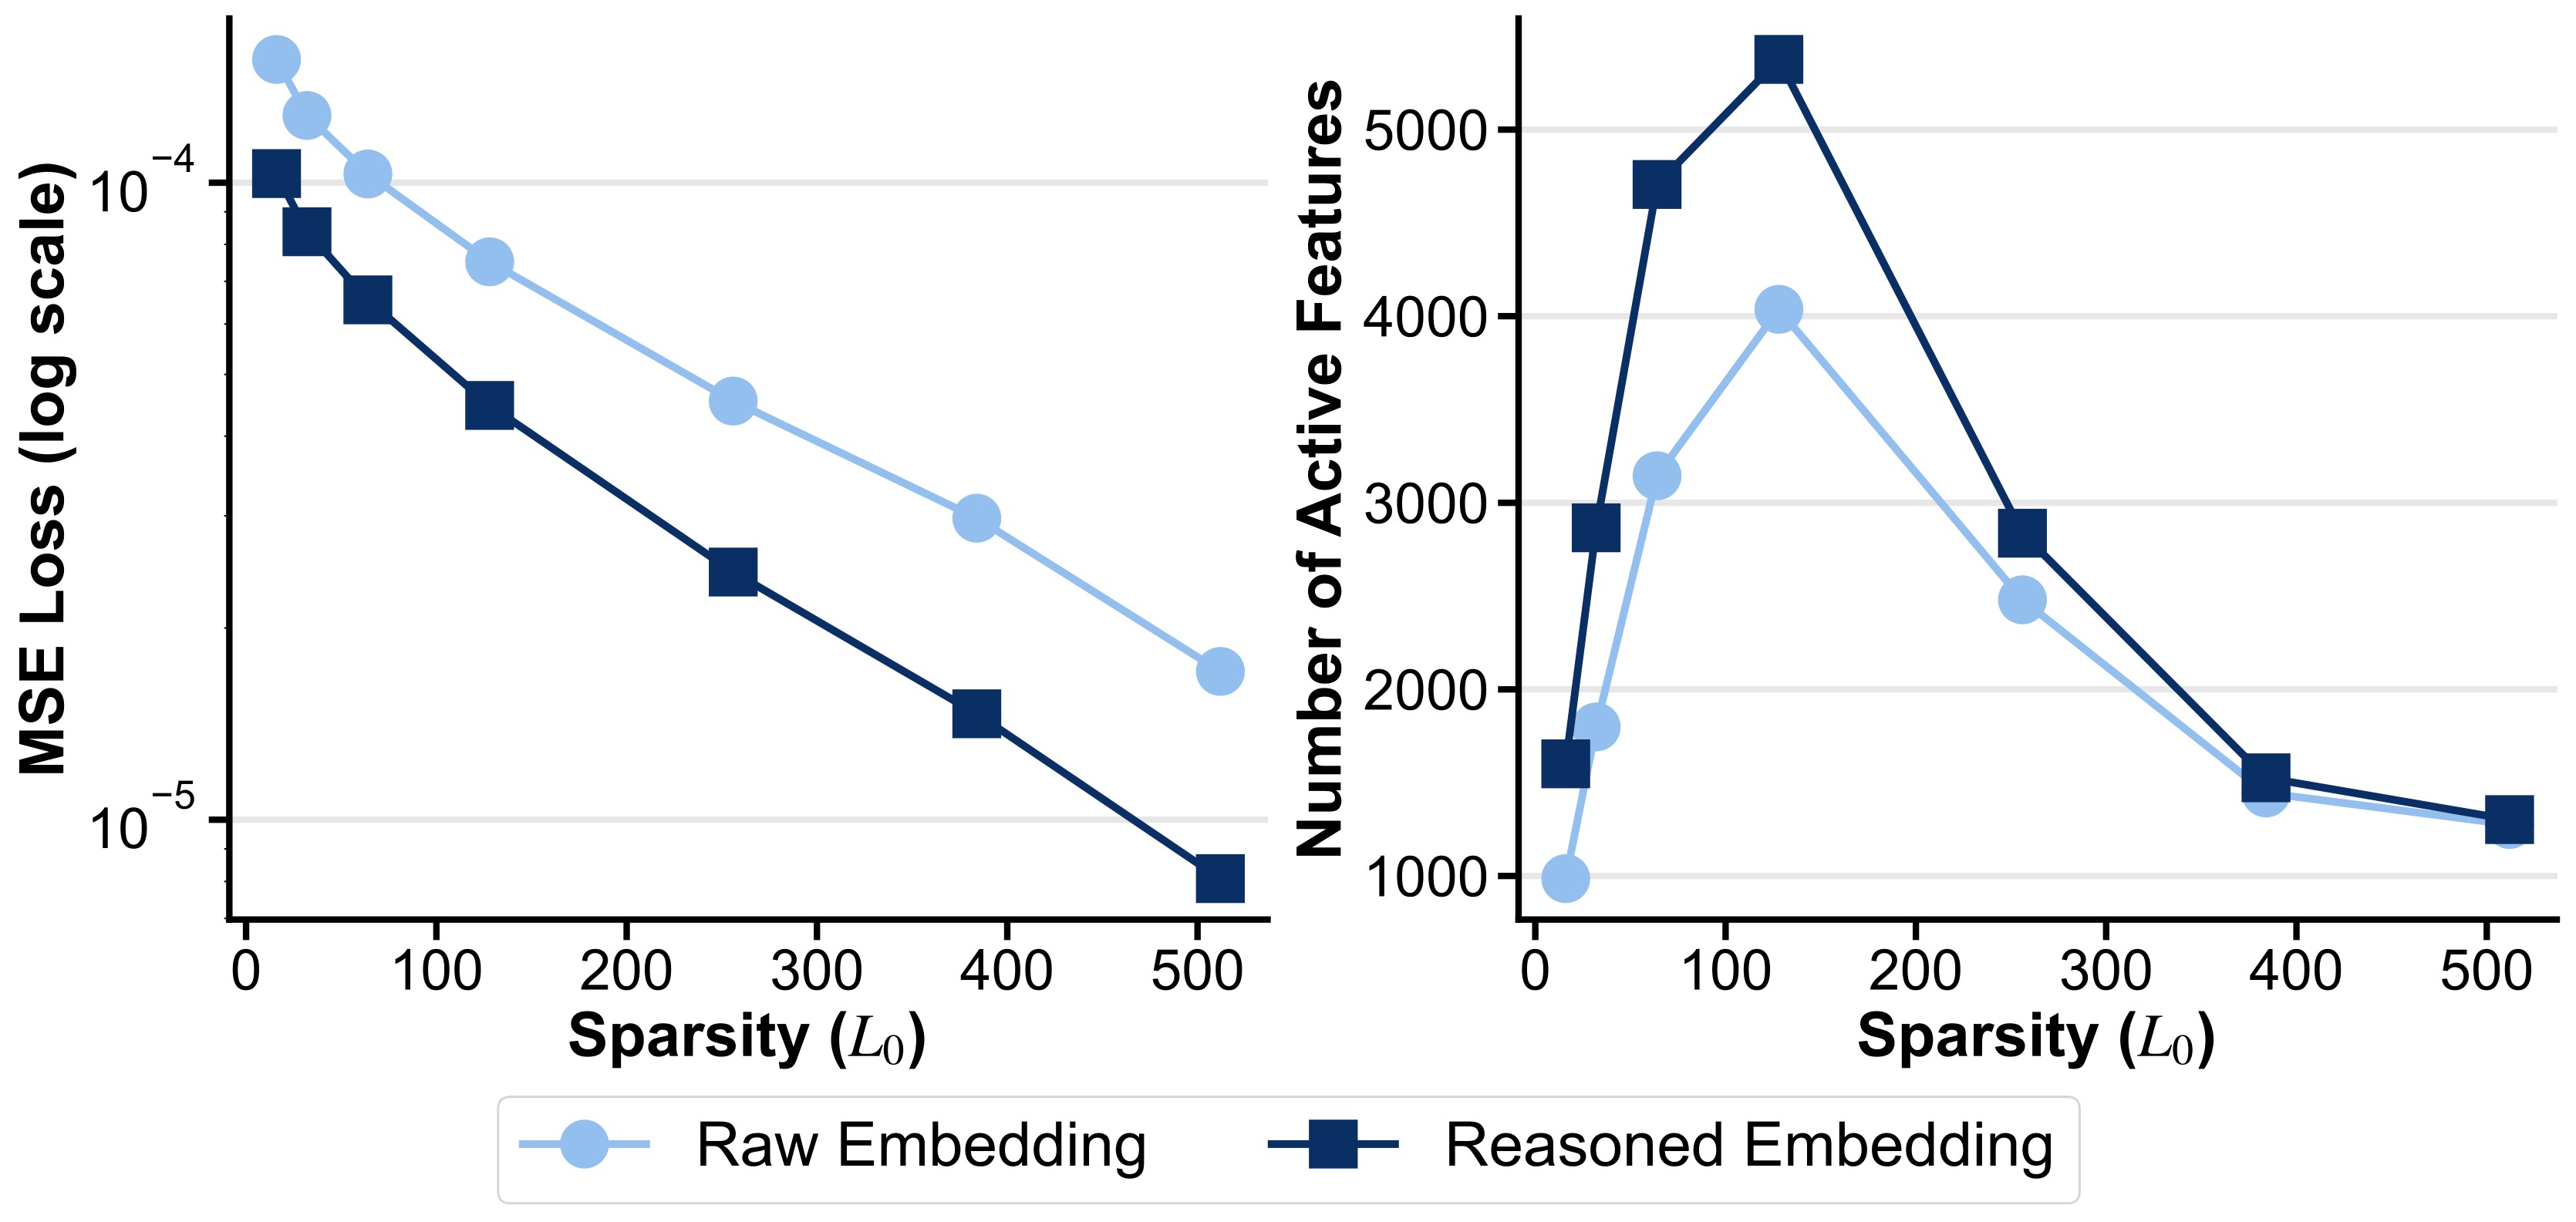
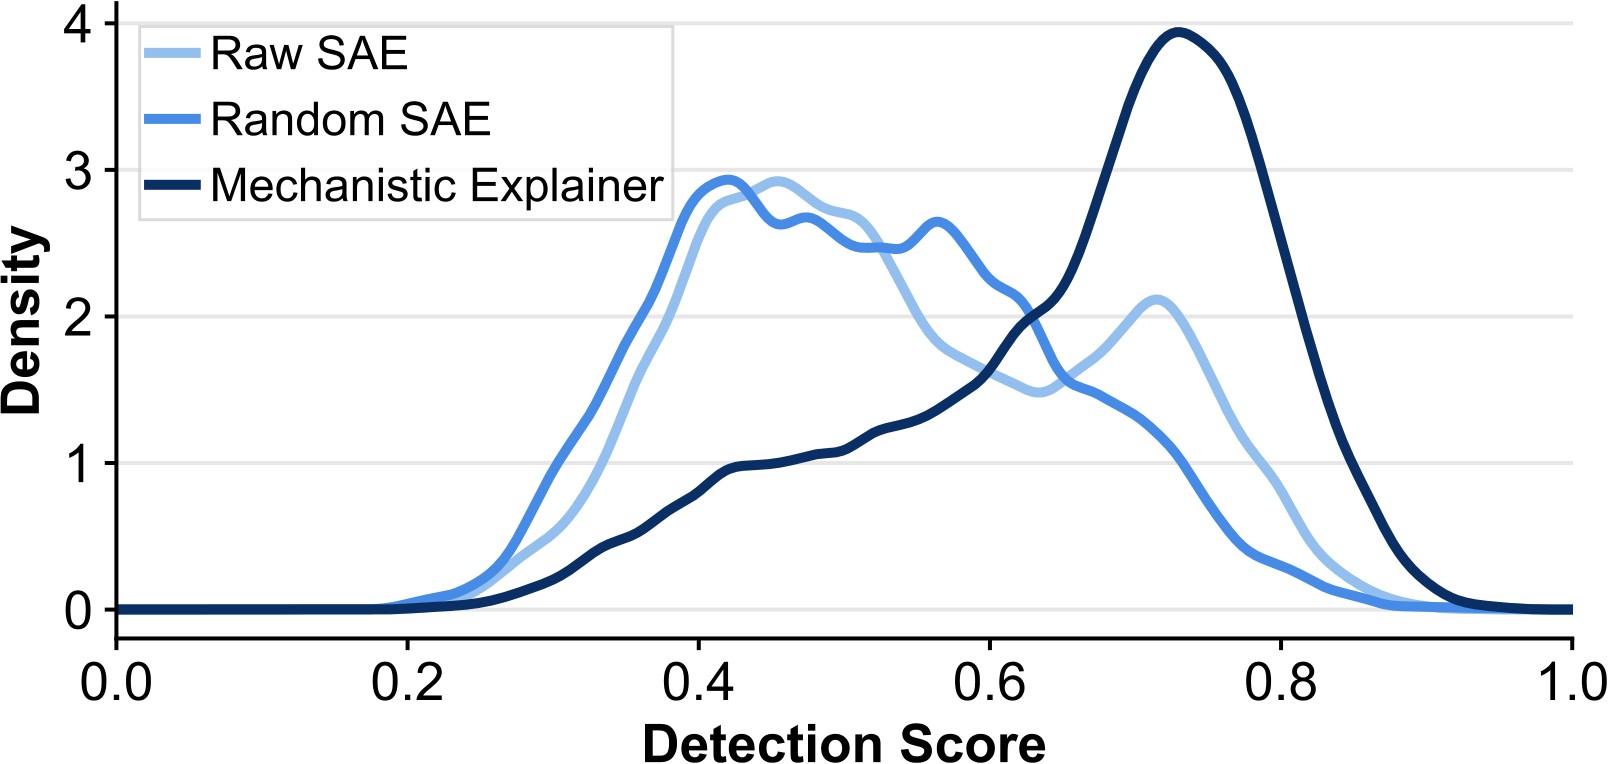
Figure 4 and Figure 5 are the main evidence that reasoning internalization helps explanation quality. Reasoned embeddings have lower reconstruction error and more active features under the same sparsity controls, and the final Xetrieval explainer has a stronger detection-score distribution than random or raw SAE baselines.
Experiments And Results
Retrieval Benefit Of Internalized Reasoning
Table 3 is the main recovered NDCG@10 table for DeepSeek-V3-powered reasoning. The most useful pattern is that the reasoning internalizer usually improves over the unenhanced retriever and often recovers a large part of the explicit CoT reasoner's gain. The exceptions matter: for Qwen3-4B, the baseline average is 69.2 while the internalizer average is 68.7 and CoT average is 68.8, so "reasoning helps" is not uniformly true for every strong base retriever and every benchmark.
| Retriever | Enhancement | BRIGHT | NQ | MuTual | TREC | Signal1M | Robust04 | ArguAna | Avg. |
|---|---|---|---|---|---|---|---|---|---|
| gte-base | None | 37.0 | 81.0 | 28.8 | 92.2 | 73.8 | 77.1 | 41.7 | 61.7 |
| gte-base | Reasoning Internalizer | 39.0 | 80.8 | 29.6 | 92.3 | 74.2 | 80.2 | 40.9 | 62.4 |
| gte-base | CoT Reasoner | 43.8 | 83.3 | 30.3 | 93.4 | 74.6 | 84.0 | 41.7 | 64.4 |
| e5-large | None | 31.5 | 83.3 | 47.1 | 90.4 | 66.8 | 77.3 | 34.2 | 61.5 |
| e5-large | Reasoning Internalizer | 37.9 | 84.2 | 46.5 | 90.3 | 70.3 | 81.1 | 39.2 | 64.2 |
| e5-large | CoT Reasoner | 43.8 | 86.3 | 47.0 | 92.8 | 72.0 | 82.1 | 41.3 | 66.5 |
| qwen3-4b | None | 51.2 | 84.0 | 45.2 | 92.3 | 74.1 | 87.0 | 50.7 | 69.2 |
| qwen3-4b | Reasoning Internalizer | 51.7 | 83.5 | 44.9 | 91.9 | 72.8 | 87.1 | 49.3 | 68.7 |
| qwen3-4b | CoT Reasoner | 54.8 | 84.6 | 45.8 | 92.9 | 73.2 | 86.7 | 43.8 | 68.8 |
| snowflake | None | 34.8 | 48.1 | 36.2 | 22.5 | 64.8 | 24.1 | 37.2 | 38.3 |
| snowflake | Reasoning Internalizer | 38.8 | 68.9 | 36.3 | 64.9 | 67.9 | 42.7 | 38.6 | 51.2 |
| snowflake | CoT Reasoner | 44.0 | 74.2 | 33.0 | 77.6 | 67.4 | 46.0 | 40.5 | 54.7 |
Table 3. NDCG@10 (%) of dense retrievers under different enhancements. This table is recovered from main.flattened.tex; paper.md contained an empty converted table block. The main text states that the reasoning internalizer and CoT reasoner are powered by DeepSeek-V3.
Explanation Efficiency
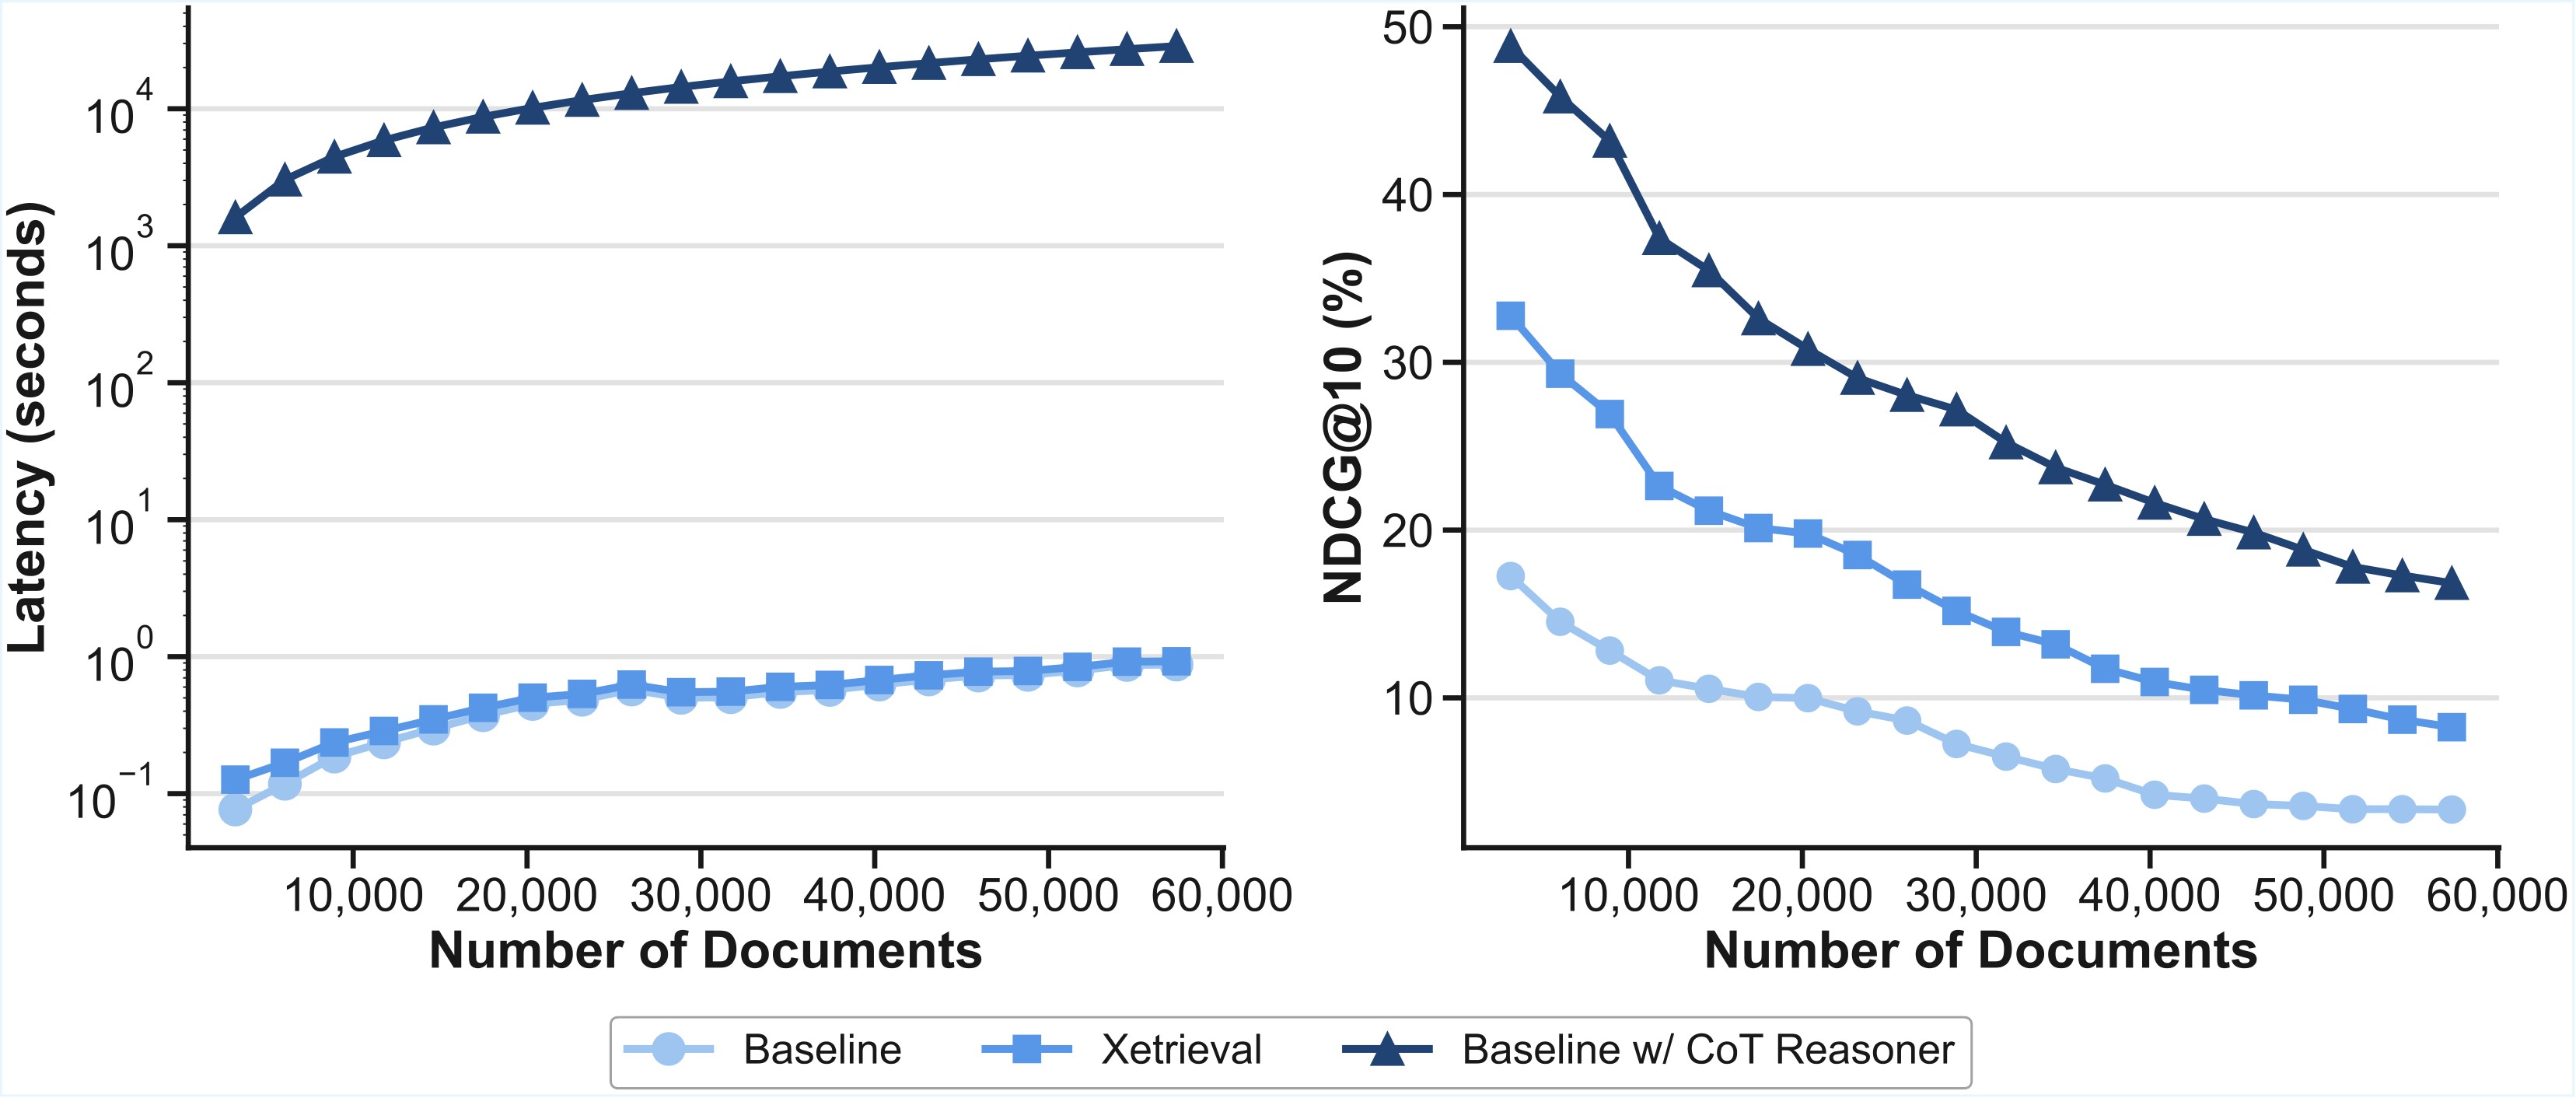
Xetrieval's main efficiency claim is that it avoids per-document autoregressive CoT generation. The CoT reasoner generates reasoning text for documents, while the internalizer runs an MLP over cached embeddings. Figure 6 is the paper's scaling evidence: as the Biology subset size increases, explicit CoT explanation time grows substantially, while Xetrieval remains near flat; the paired retrieval plot shows Xetrieval staying above the base retriever and close to CoT-enhanced retrieval as candidate size changes.
Local Attribution
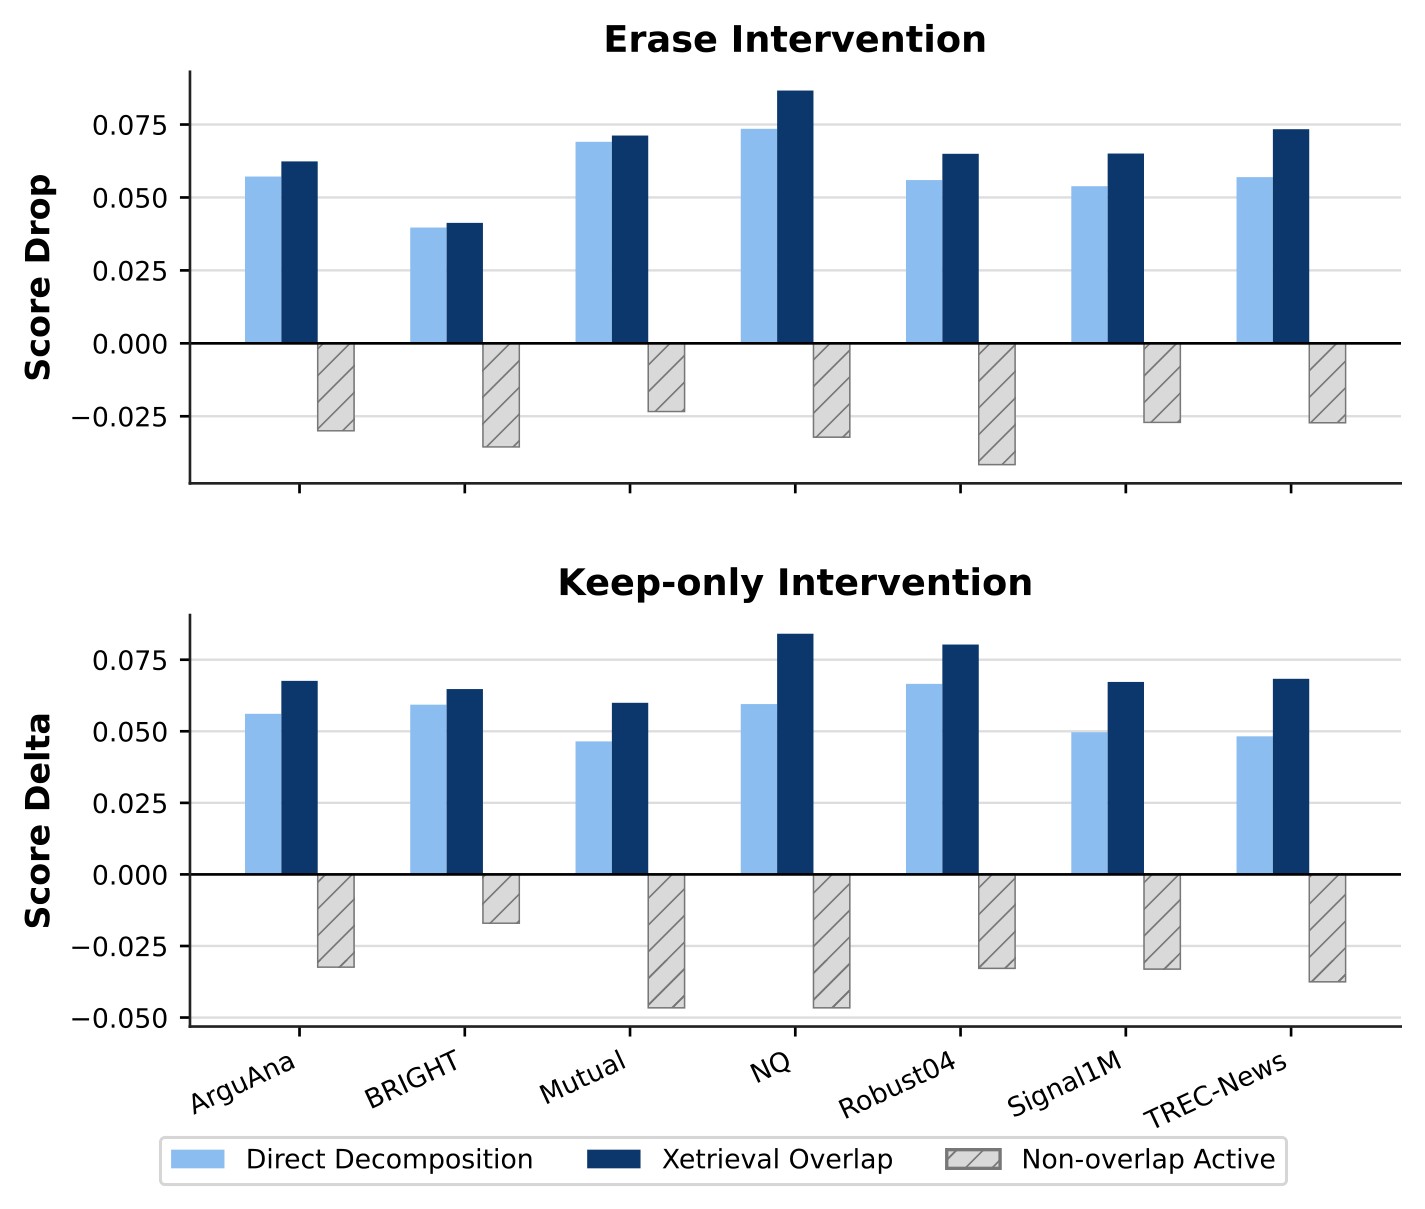
The pair-level intervention asks whether the selected features are actually tied to a query-document similarity score. For a query-document pair, the paper compares three feature sets: direct-decomposition overlaps, Xetrieval overlaps across reasoned document views, and non-overlap active features as a control. It then intervenes on the original document embedding, either erasing the selected feature span or retaining only that span.
The appendix describes the projection used for these interventions. For feature set \(S\), decoder directions \(W_S\), decoder bias \(\mathbf{b}\), and \(\lambda=10^{-6}\):
The two edited document embeddings are:
Figure 7 reports the intervention effect. Erasing Xetrieval-selected features produces the largest similarity drop; retaining only those features preserves or increases similarity more effectively than direct decomposition. The non-overlap controls behave less consistently and can even increase score when erased, which supports the interpretation that they are query-irrelevant or distracting document factors.
Task-Level Steering
For global feature utility, the paper defines a Retrieval Utility Score (RUS). A feature's co-activation indicator is
The paper scores features by how often they co-activate on positive pairs minus negative pairs:
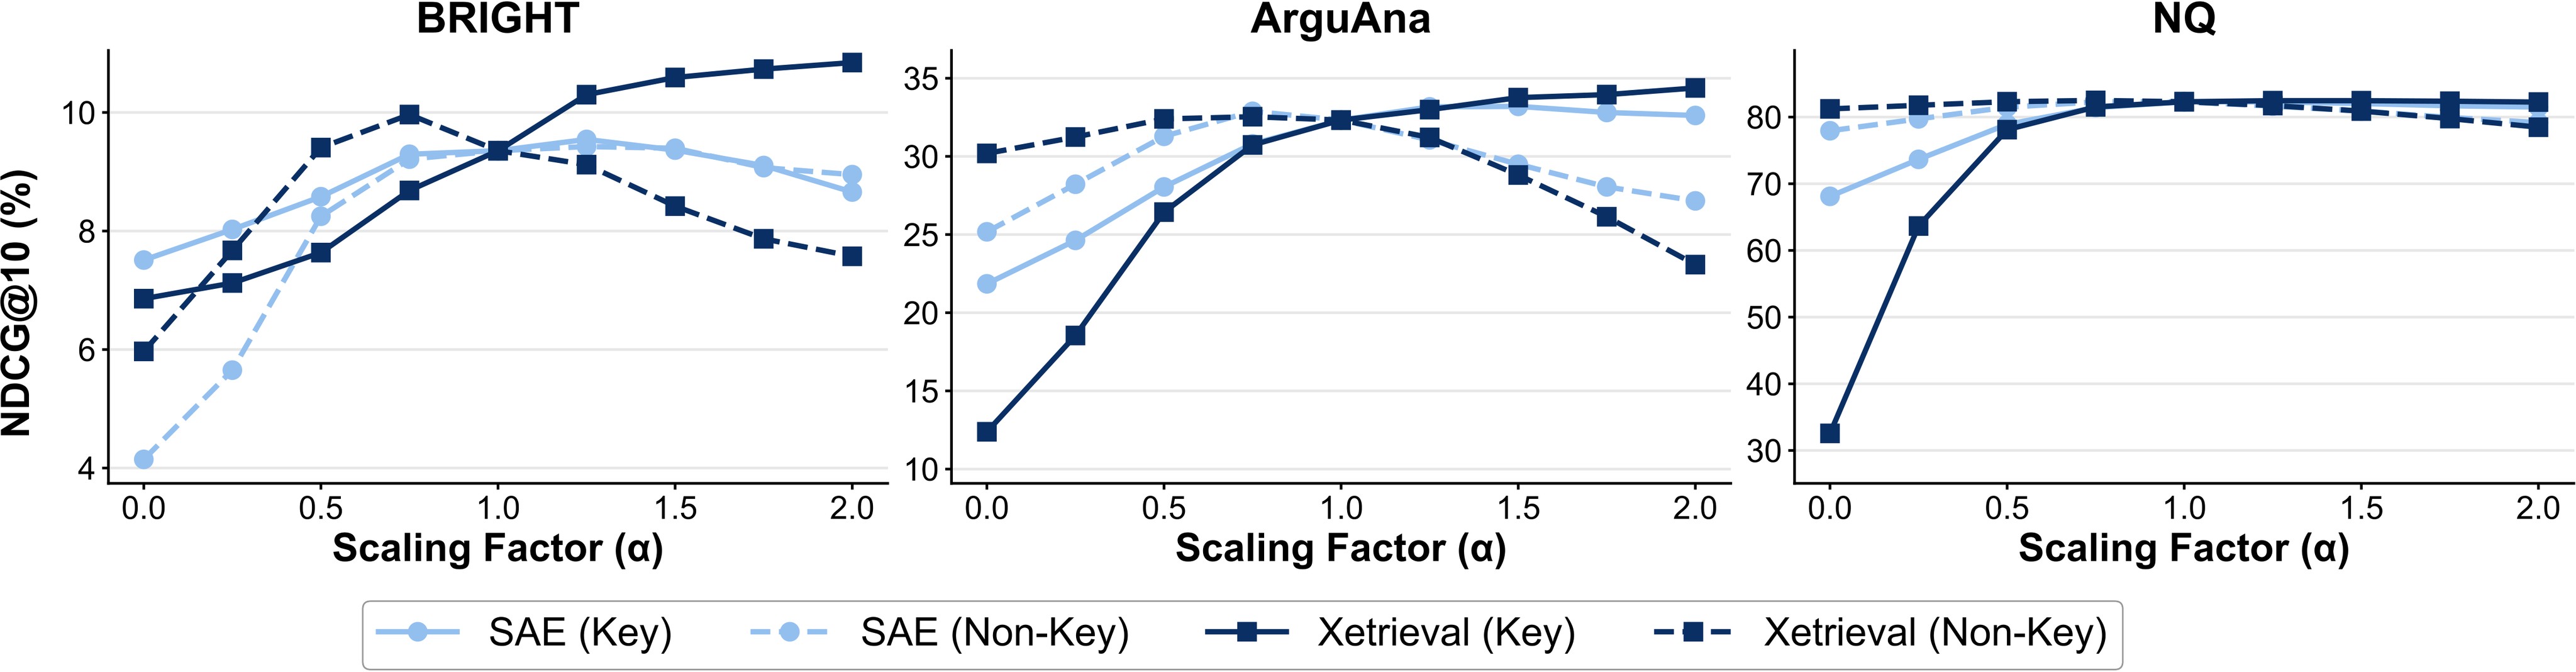
The top RUS features form a key set. During steering, selected activations are amplified with \(\alpha>1\) or suppressed with \(\alpha<1\), then retrieval is evaluated on BRIGHT, ArguAna, and NQ. Figure 8 shows that amplifying key features improves retrieval while suppressing them hurts, and that Xetrieval-selected features have stronger steering effects than direct raw-SAE features.
What The Evidence Supports
The strongest evidence is intervention-based. If the feature set were only a plausible label set, erasing or retaining it would not necessarily move the original embedding similarity in the predicted direction. Figure 7 and Figure 8 therefore do important work: they connect the chosen feature directions to local similarity and task-level ranking behavior.
The retrieval-benefit evidence is useful but less clean. Table 3 shows large gains for weak or mid-strength retrievers such as Snowflake and e5-large, but it also shows the internalizer slightly underperforming the strong qwen3-4b baseline on average. This does not invalidate the explainer, but it means the digest should separate two claims: Xetrieval's reasoning views often help retrieval and explanation, while retrieval-score improvement is not guaranteed for every already-strong embedder.
Practical Takeaways
- The reusable idea is to turn expensive CoT reasoning into learned embedding views, then use those views as additional surfaces for sparse feature overlap.
- The paper is most valuable for auditing retrieval decisions, diagnosing false positives, and comparing what a retriever thinks is shared between a query and a document.
- The strongest mechanistic evidence comes from feature intervention, not from the generated natural-language feature names alone.
- The main caution is scope: this is output-embedding interpretability, not a circuit analysis of the dense encoder. The paper's own limitation in the limitations section is important for high-stakes explanations.
- The main empirical weakness is that several result details are figure-only or appendix-heavy, and the broad "reasoning improves retrieval" statement has exceptions in the main NDCG table.
The paper's limitation statement says the analysis is confined to the sentence embedding level, specifically the output layer of the embedding model. It also says SAE decomposition offers limited fidelity and granularity compared with stronger mechanisms such as transcoders. That limitation should travel with any downstream use of Xetrieval explanations: they are useful sparse evidence surfaces, not definitive causal accounts of the full retriever.