Source-first digest for checked paper rank 45, rank_id p019.
- Routing status:
success - PDF extraction: not used
Motivation / Background
Dense retrievers are often used as the first stage in open-domain QA and retrieval-augmented generation, so a systematic preference for early document evidence can become a downstream evidence-missing failure. The paper starts from an unresolved causal question: is this position bias mostly baked into transformer architecture and pooling, or can retrieval fine-tuning data redirect the bias?
The authors argue that prior evidence is mostly observational. MS MARCO and many natural corpora are early-skewed, and earlier dense-retrieval studies found primacy bias across architectures, but those results do not isolate the training-position distribution. This paper builds a controlled intervention: generate position-targeted query-document training examples, verify that the query is answerable from the intended document segment, and fine-tune the same model families under begin-, middle-, end-, and uniformly distributed evidence positions.
The central design is visible in the controlled sampling setup: the retained-pool table shows the verified candidate pool, while the model overview table shows why the test is not tied to one architecture family.
| Length bin | Begin | Middle | End |
|---|---|---|---|
| 256-512 | 105,652 | 13,934 | 21,405 |
| 512-1024 | 86,495 | 16,660 | 21,427 |
| 1024-2048 | 60,357 | 13,594 | 16,691 |
| 2048-4096 | 43,946 | 10,527 | 13,363 |
| 4096-8192 | 39,200 | 8,189 | 9,796 |
| Total | 335,650 | 62,904 | 82,682 |
Table. Retained candidate examples. Candidates are retained after the multi-reranker verification rule with margin threshold \(\delta=0.3\), before downsampling. I include this table because it explains why controlled downsampling is needed: the high-confidence pool is large but strongly begin-skewed.
| Model | Type | Positional encoding | Pooling | Params | Max length |
|---|---|---|---|---|---|
| BERT-base | Encoder | APE | CLS | 110M | 512 |
| Longformer-base | Encoder | APE | Mean | 149M | 4k |
| ModernBERT-base | Encoder | RoPE | CLS | 149M | 8k |
| ModernBERT-large | Encoder | RoPE | CLS | 395M | 8k |
| GPT-2-medium | Decoder | APE | Last token | 355M | 1k |
| BLOOM-560M | Decoder | ALiBi | Last token | 560M | 2k |
| TinyLlama-NoPE | Decoder | NoPE | Last token | 1.1B | 2k |
| Qwen3-0.6B | Decoder | RoPE | Last token | 0.6B | 32k |
Table. Model families. The experiments span encoder and decoder retrievers, multiple positional encodings, and different pooling strategies. This matters because a consistent direction shift across this table would weaken a purely architectural explanation.
Claims And Evidence
| Claim id | Main claim | Support | Evidence anchors |
|---|---|---|---|
| C1 | Retrieval-level position-bias direction is strongly shaped by the evidence-position distribution used during fine-tuning. | 5 | controlled setup, main position-aware results, mirror reversal, representation shift |
| C2 | Position-balanced fine-tuning reduces positional sensitivity while preserving competitive mean retrieval performance. | 5 | main results table, PosIR results, PSI definition |
| C3 | Architecture and pretraining are not sufficient explanations for the observed retrieval-level bias direction. | 4 | model overview, main results, pooling ablation, limitations |
| C4 | Standard BEIR scores can partly reward early-position priors when benchmark evidence is early-skewed. | 4 | BEIR evidence-position figure, BEIR table, BEIR interpretation |
| C5 | The generated position-targeted training data is reasonably high-confidence under model-based checks, but still not human-labeled ground truth. | 4 | data pool, verification rule, retained pool, LLM audit, limitations |
| C6 | Fine-tuning can reshape query-document and document-only representations toward the emphasized evidence position. | 4 | evidence-moving table, document-segment heatmap, all-model heatmap |
Scores are support-from-paper scores, not independent reproduction scores. Claims about causality are strong within the controlled synthetic setting, but the paper itself narrows them because generated queries, segment content, discourse role, and difficulty can remain entangled with physical position.
Core Technical Idea
The paper turns position bias into a controlled data intervention. For each English Wikipedia document, it divides the text into beginning, middle, and end segments, asks GPT-4o-mini to generate a query answerable from a target segment, filters the generated query with multiple cross-encoder rerankers, and then constructs matched fine-tuning sets:
- \(\mathcal{M}_B\): all training queries target the beginning segment.
- \(\mathcal{M}_M\): all training queries target the middle segment.
- \(\mathcal{M}_E\): all training queries target the end segment.
- \(\mathcal{M}_U\): training queries are distributed uniformly over beginning, middle, and end.
The important control is that the four configurations are matched in training scale and document-length distribution. Each concentrated configuration samples 8,189 examples from the target position in each length bin, giving 40,945 examples. The uniform configuration samples 2,729 examples from each position within each length bin, giving 40,935 examples. This makes the main comparison about evidence position rather than dataset size or document length.
Method Details
Position-Targeted Data Construction
The query generator is not trusted by itself. The paper uses three cross-encoder rerankers as position verifiers: bge-reranker-v2-m3, gte-multilingual-reranker-base, and jina-reranker-v2-base-multilingual. For a query \(q\), a segment \(s_i\), and a reranker \(R\), the reranker score is:
The candidate is retained only when every reranker scores the intended target segment \(t\) above the best non-target segment by at least \(\delta\):
For the main experiments, \(\delta=0.3\). The LLM audit table is referenced from the main text because it is the paper's sanity check that larger reranker margins correlate with segment-exclusive answerability.
| Reranker condition | Target Yes | Distractor No | Exclusive |
|---|---|---|---|
| Failed top-rank check | 87.7% | 73.8% | 51.4% |
| \(0 \le m_{\mathrm{cons}} < 0.1\) | 93.4% | 83.5% | 67.0% |
| \(0.1 \le m_{\mathrm{cons}} < 0.2\) | 93.7% | 90.2% | 77.7% |
| \(0.2 \le m_{\mathrm{cons}} < 0.3\) | 94.7% | 94.4% | 85.3% |
| \(0.3 \le m_{\mathrm{cons}}\) | 95.4% | 97.0% | 90.4% |
Table. Segment-wise LLM audit. The highest-margin stratum, which corresponds to the retained pool used for training, reaches 95.4% Target Yes, 97.0% Distractor No, and 90.4% Exclusive in the model-based audit.
Training And Evaluation
All eight models are fine-tuned as bi-encoder retrievers with InfoNCE loss and chunk-aware negatives. The paper deliberately avoids hard negative mining because it could introduce position-dependent confounds. The shared settings are AdamW, batch size 256, 3 epochs, warmup ratio 0.1, similarity scale 20.0, seed 42, and model-specific learning rates.
Evaluation uses nDCG@10 separately on beginning, middle, and end evidence subsets. The summary statistic is Position Sensitivity Index:
Here \(s=\{s_{\mathrm{begin}},s_{\mathrm{mid}},s_{\mathrm{end}}\}\). A lower PSI means less sensitivity to where the relevant evidence appears. This metric is always interpreted with mean nDCG@10 so that a uniformly bad retriever is not mistaken for a robust one.
Experiments And Results
Position-Aware Retrieval Benchmarks
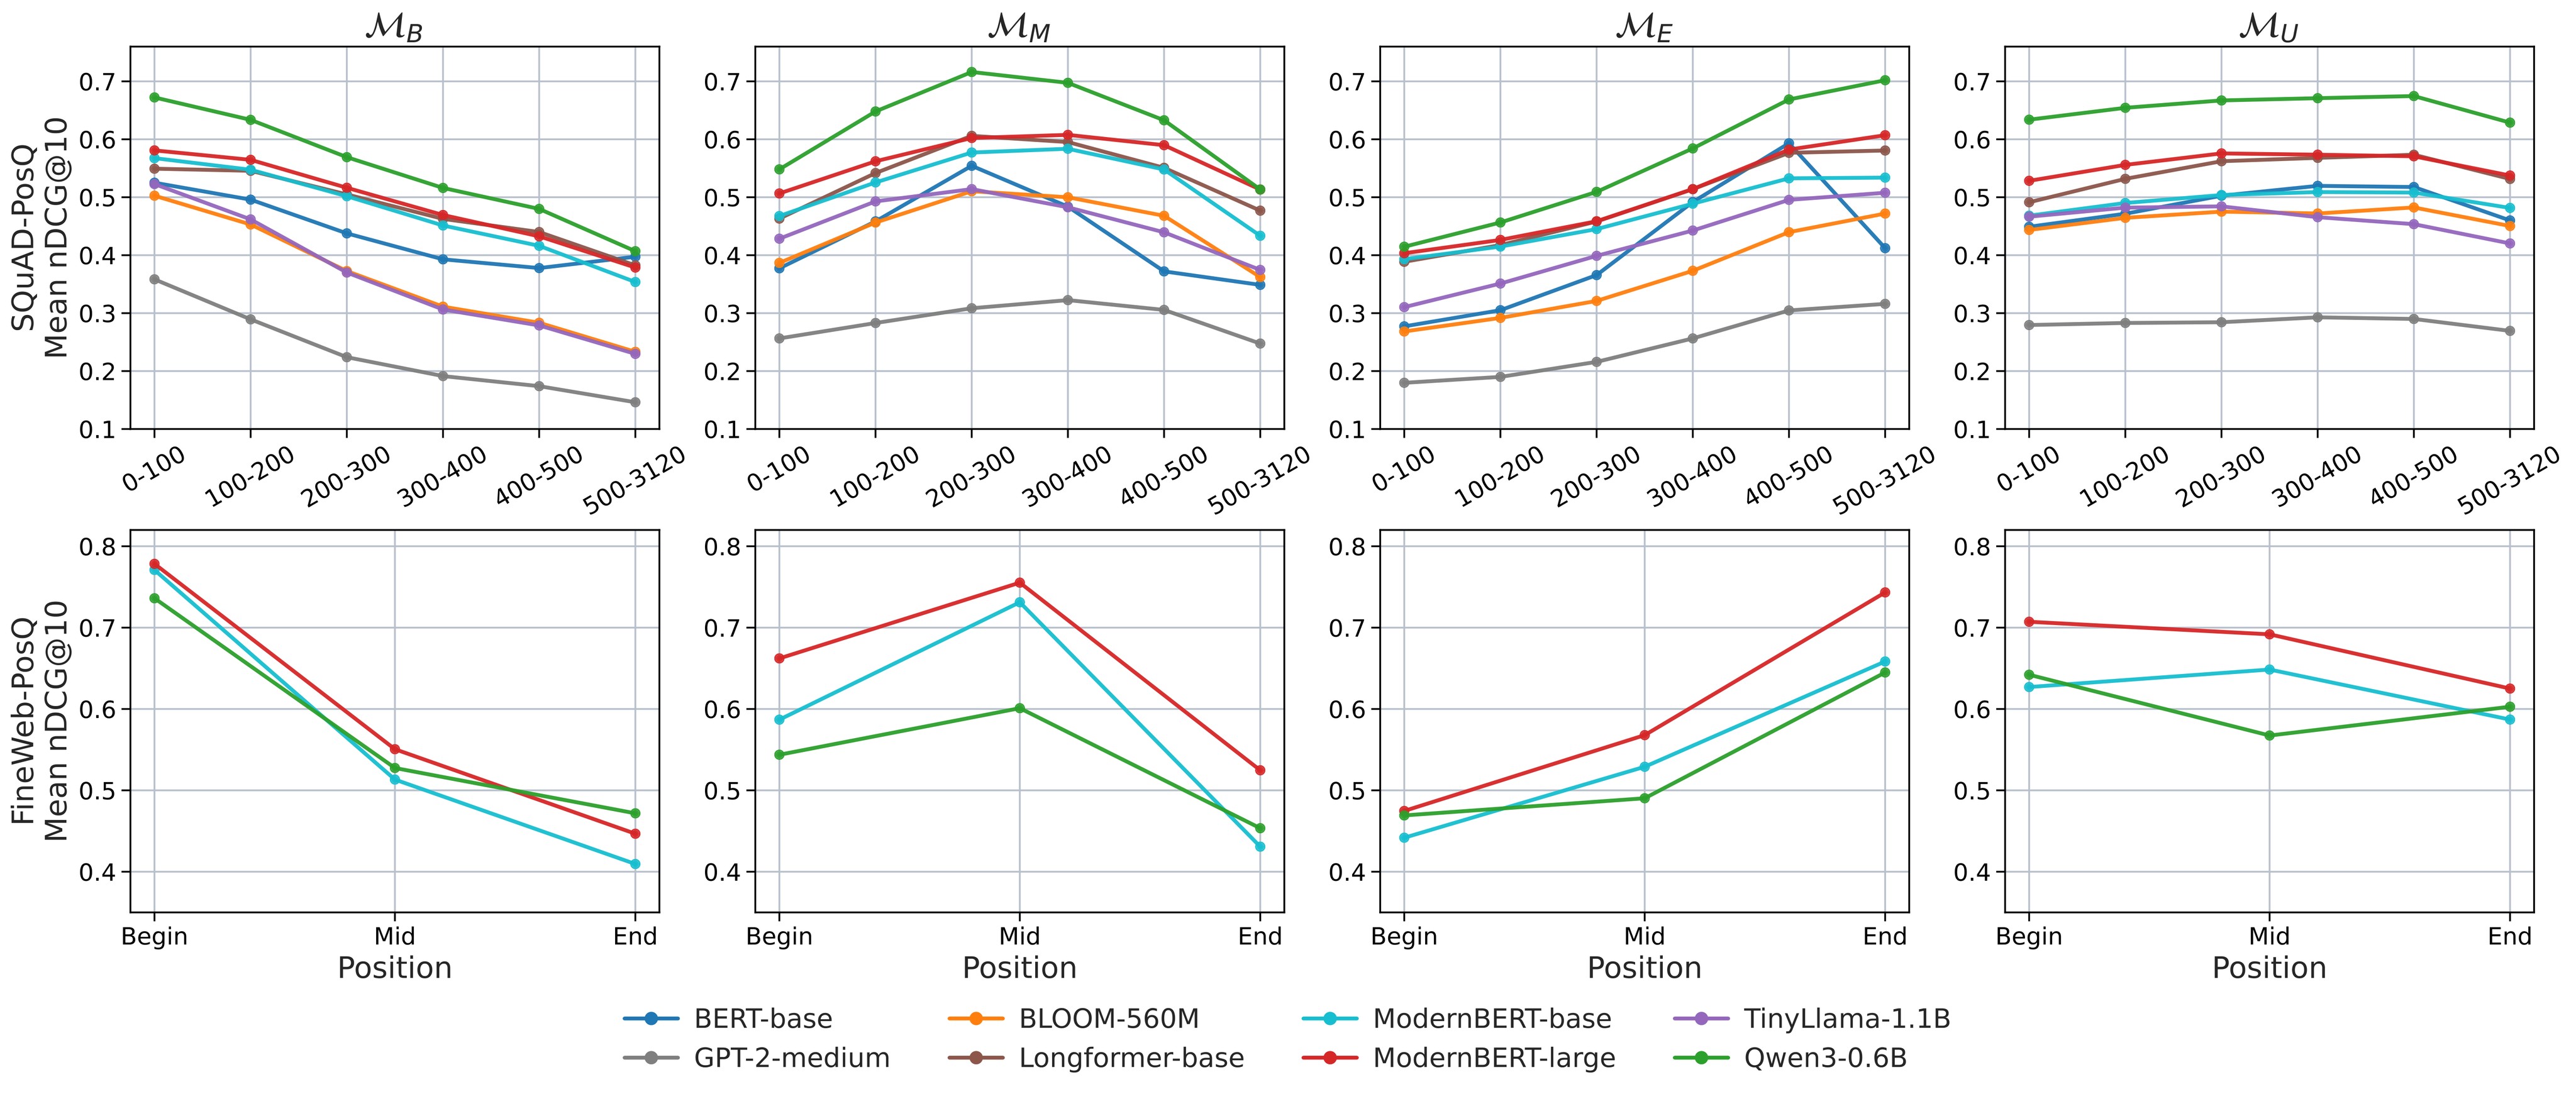
Figure 1 and Table 1 are the main evidence for C1 and C2. The figure shows the position-wise curves; the table recovers the mean nDCG@10 and PSI values from the LaTeX source because the Markdown table header is malformed.
| Benchmark / model | \(\mathcal{M}_B\) nDCG | \(\mathcal{M}_M\) nDCG | \(\mathcal{M}_E\) nDCG | \(\mathcal{M}_U\) nDCG | \(\mathcal{M}_B\) PSI | \(\mathcal{M}_M\) PSI | \(\mathcal{M}_E\) PSI | \(\mathcal{M}_U\) PSI |
|---|---|---|---|---|---|---|---|---|
| SQuAD-PosQ / BERT-base | 0.438 | 0.432 | 0.408 | 0.487 | 0.281 | 0.371 | 0.533 | 0.136 |
| SQuAD-PosQ / Longformer-base | 0.481 | 0.539 | 0.489 | 0.543 | 0.304 | 0.236 | 0.331 | 0.143 |
| SQuAD-PosQ / ModernBERT-base | 0.466 | 0.520 | 0.463 | 0.516 | 0.433 | 0.286 | 0.341 | 0.088 |
| SQuAD-PosQ / ModernBERT-large | 0.490 | 0.564 | 0.499 | 0.557 | 0.348 | 0.166 | 0.335 | 0.082 |
| SQuAD-PosQ / GPT-2-medium | 0.231 | 0.287 | 0.244 | 0.283 | 0.592 | 0.233 | 0.431 | 0.080 |
| SQuAD-PosQ / BLOOM-560M | 0.359 | 0.447 | 0.361 | 0.465 | 0.536 | 0.290 | 0.431 | 0.080 |
| SQuAD-PosQ / TinyLlama-NoPE | 0.362 | 0.455 | 0.418 | 0.462 | 0.561 | 0.271 | 0.389 | 0.132 |
| SQuAD-PosQ / Qwen3-0.6B | 0.546 | 0.626 | 0.556 | 0.655 | 0.395 | 0.283 | 0.409 | 0.068 |
| FineWeb-PosQ / ModernBERT-base | 0.554 | 0.570 | 0.571 | 0.640 | 0.476 | 0.422 | 0.343 | 0.108 |
| FineWeb-PosQ / ModernBERT-large | 0.592 | 0.647 | 0.595 | 0.675 | 0.426 | 0.305 | 0.361 | 0.116 |
| FineWeb-PosQ / Qwen3-0.6B | 0.578 | 0.533 | 0.535 | 0.604 | 0.359 | 0.245 | 0.272 | 0.116 |
Table 1. Mean nDCG@10 and PSI. Uniform training has the lowest PSI for every model on SQuAD-PosQ and for every evaluated long-context model on FineWeb-PosQ. On SQuAD-PosQ, the paper reports that \(\mathcal{M}_U\) reduces PSI by 57-87% relative to the worst skewed configuration.
The paper gives concrete directional examples. On SQuAD-PosQ, Qwen3-0.6B scores 0.672 in the 0-100 bucket under begin training but 0.415 under end training; in the 500-3120 bucket, the end-trained model scores 0.702 versus 0.407 for begin training. On FineWeb-PosQ, ModernBERT-large similarly favors the position it was trained on: beginning evidence scores 0.778 under \(\mathcal{M}_B\) versus 0.475 under \(\mathcal{M}_E\), while end evidence scores 0.743 under \(\mathcal{M}_E\) versus 0.447 under \(\mathcal{M}_B\). This is the clearest evidence that the bias direction can be redirected by training data.
Standard BEIR Evaluation
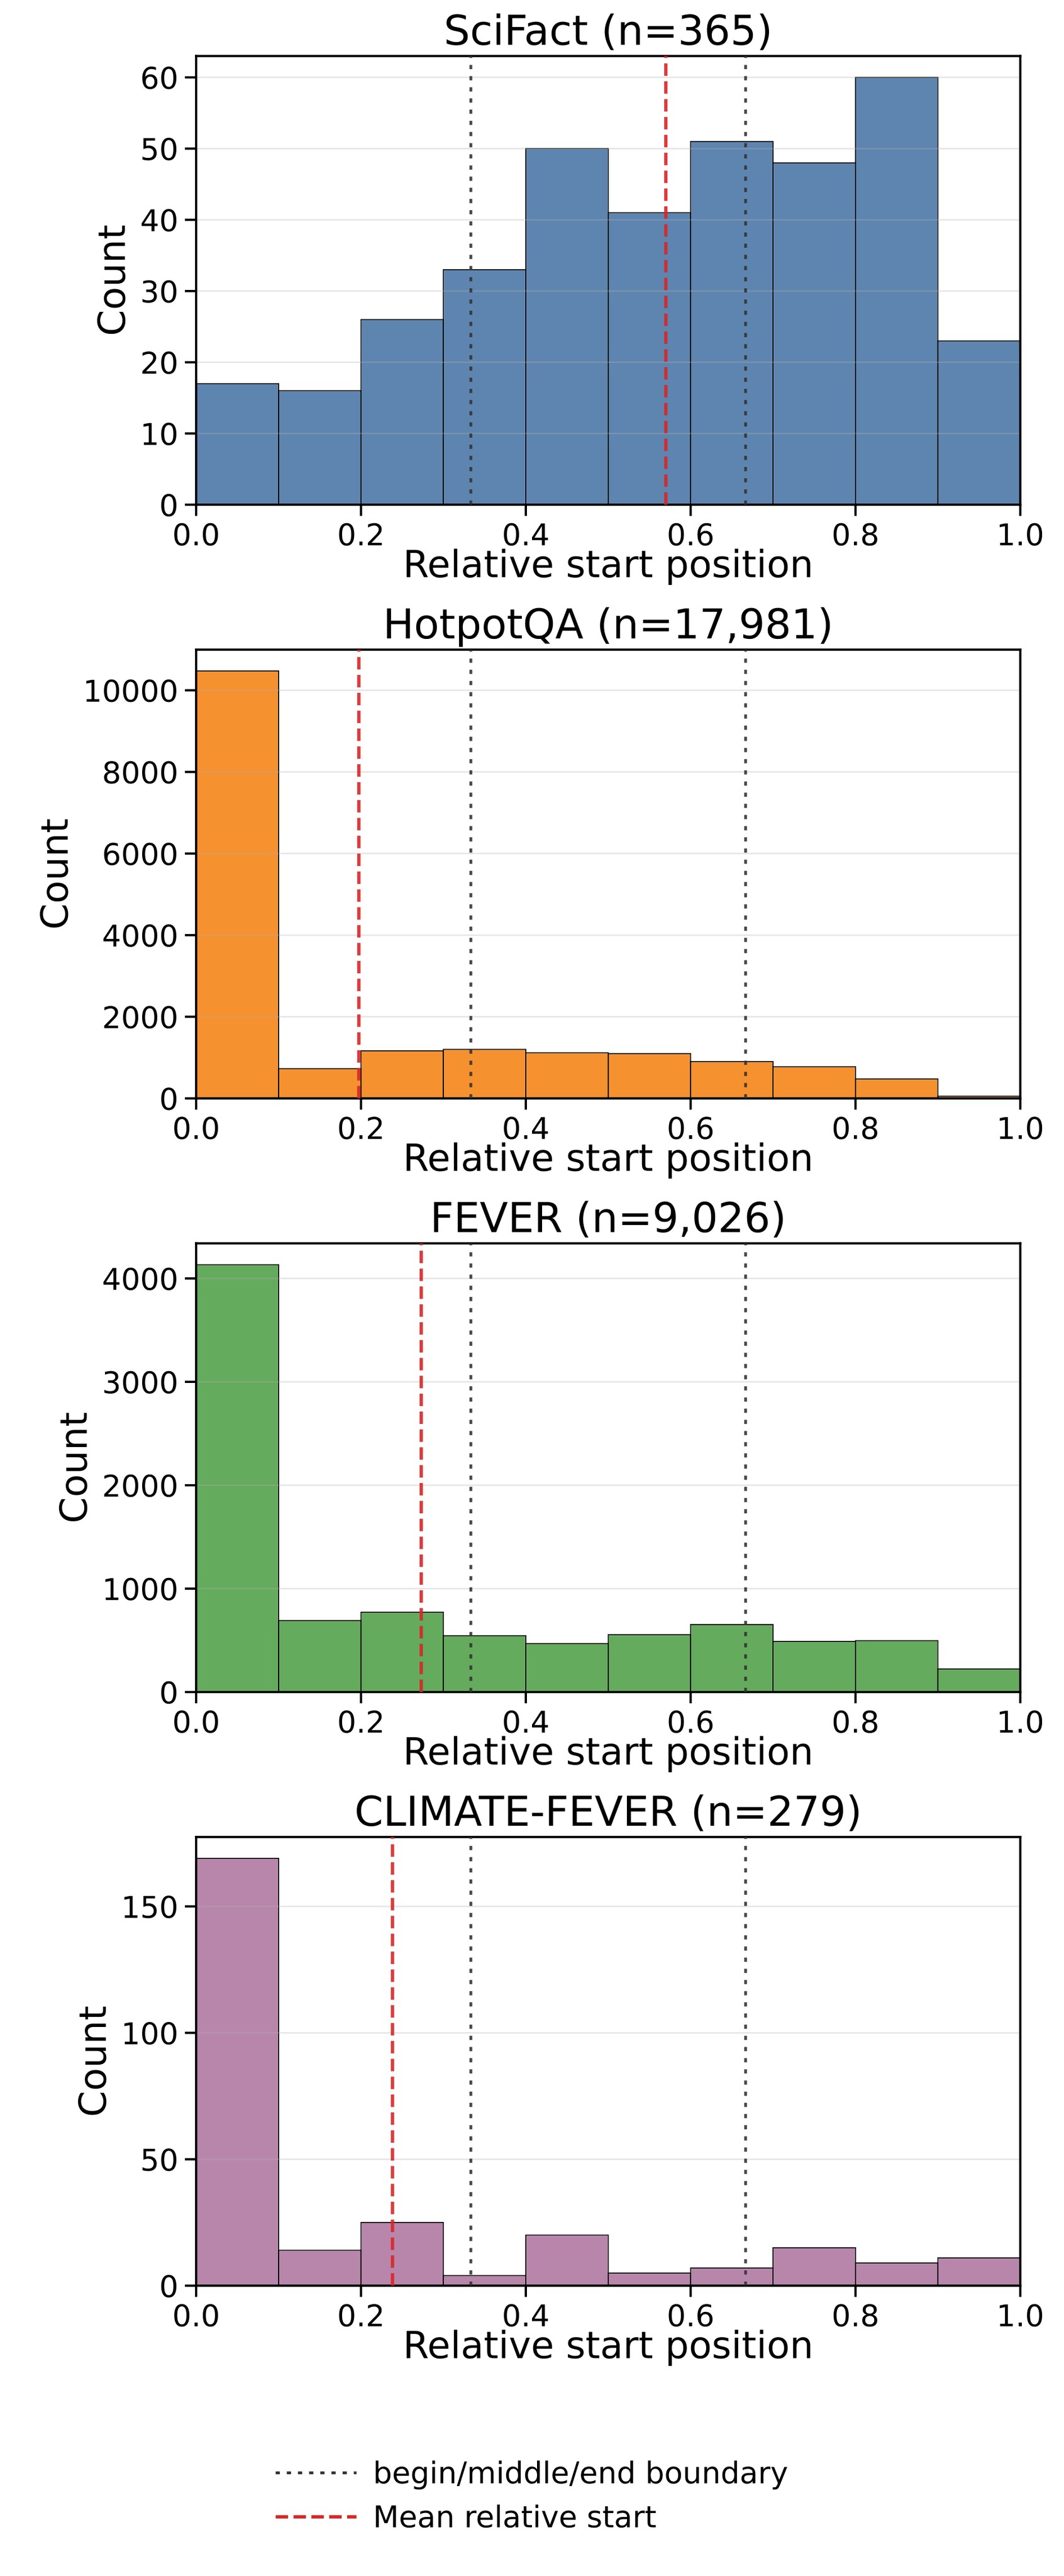
The BEIR result is more nuanced. Figure 2 shows that several evaluated BEIR subsets place evidence near the beginning. Table 2 then shows that begin-trained retrievers obtain the highest average nDCG@10 across these subsets. This supports the paper's warning that standard benchmark gains can reflect evidence-location skew rather than position robustness.
| BEIR subset | \(\mathcal{M}_B\) | \(\mathcal{M}_M\) | \(\mathcal{M}_E\) | \(\mathcal{M}_U\) |
|---|---|---|---|---|
| SciFact | 0.351 | 0.368 | 0.340 | 0.393 |
| HotpotQA | 0.338 | 0.192 | 0.165 | 0.284 |
| FEVER | 0.491 | 0.164 | 0.156 | 0.357 |
| Climate-FEVER | 0.153 | 0.125 | 0.109 | 0.154 |
| Average | 0.333 | 0.212 | 0.193 | 0.297 |
Table 2. BEIR nDCG@10 averaged over all eight models. Begin training wins on average, especially on FEVER and HotpotQA where evidence is early-concentrated. Uniform training is best on SciFact and effectively tied on Climate-FEVER, where the early skew is weaker.
PosIR And Mirror Reversal
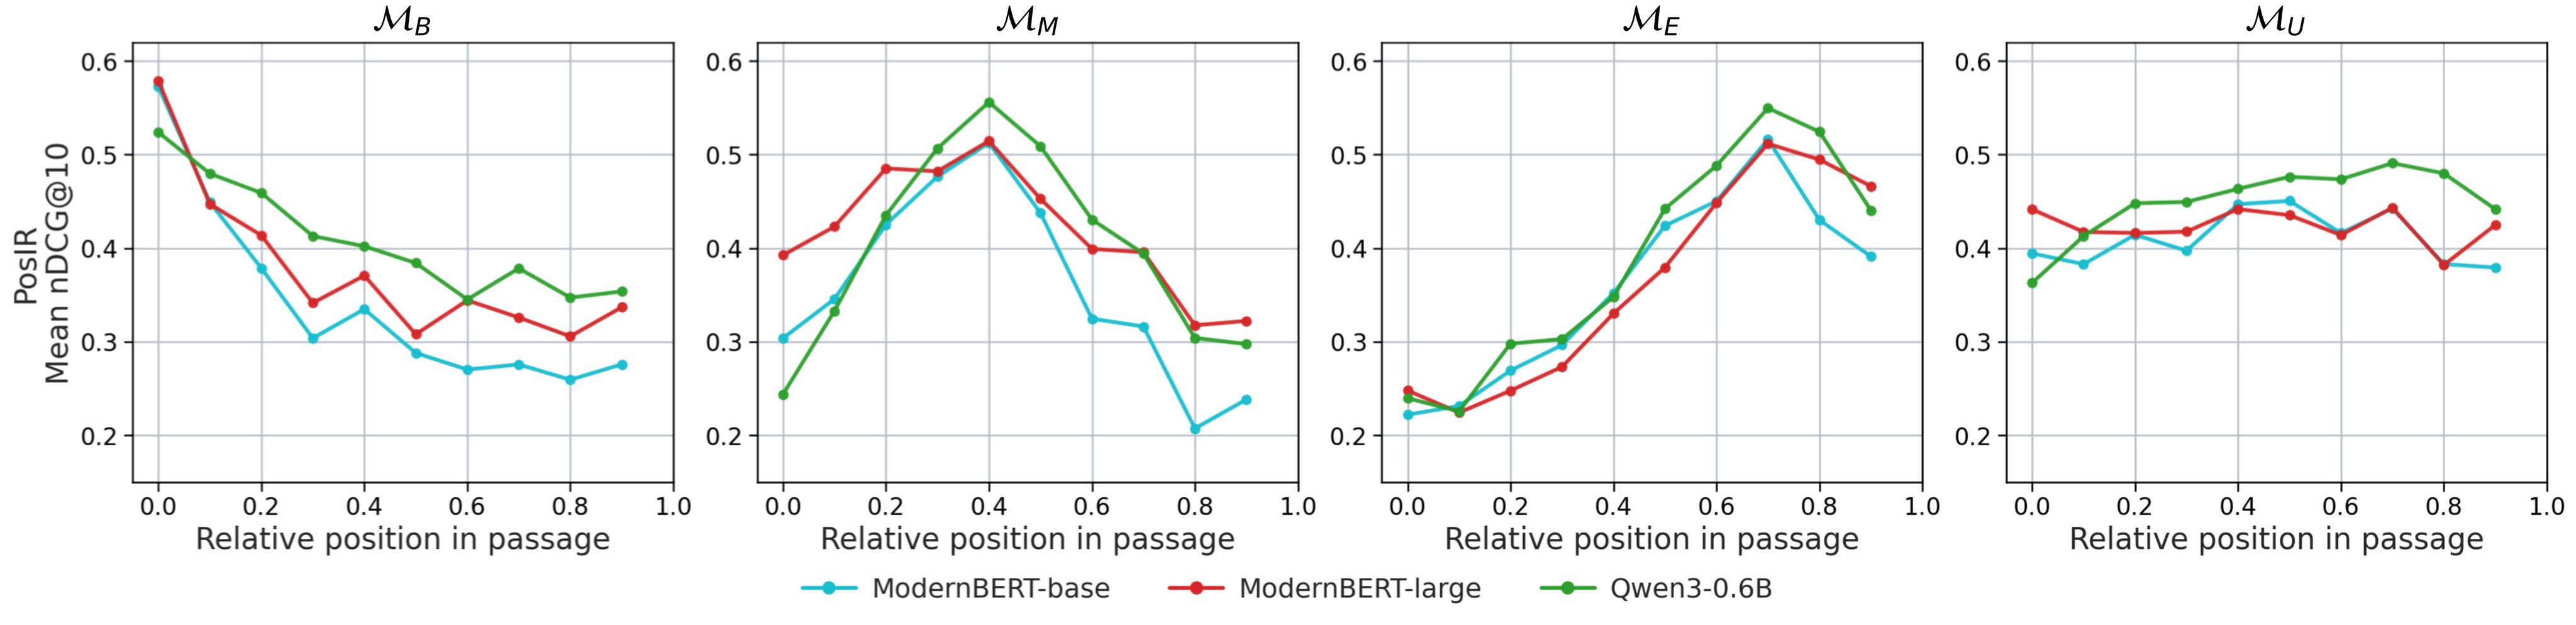
Figure 3 and Table 3 show that the same broad pattern extends to PosIR for the long-context models. Uniform training has the best mean nDCG@10 and lowest PSI for ModernBERT-base, ModernBERT-large, and Qwen3-0.6B.
| Model | \(\mathcal{M}_B\) nDCG | \(\mathcal{M}_M\) nDCG | \(\mathcal{M}_E\) nDCG | \(\mathcal{M}_U\) nDCG | \(\mathcal{M}_B\) PSI | \(\mathcal{M}_M\) PSI | \(\mathcal{M}_E\) PSI | \(\mathcal{M}_U\) PSI |
|---|---|---|---|---|---|---|---|---|
| ModernBERT-base | 0.341 | 0.359 | 0.358 | 0.411 | 0.547 | 0.596 | 0.570 | 0.158 |
| ModernBERT-large | 0.377 | 0.419 | 0.362 | 0.423 | 0.472 | 0.383 | 0.562 | 0.138 |
| Qwen3-0.6B | 0.409 | 0.401 | 0.386 | 0.450 | 0.341 | 0.562 | 0.590 | 0.261 |
Table 3. PosIR mean nDCG@10 and PSI. The paper reports PSI reductions relative to the worst skewed configuration of 73.5% for ModernBERT-base, 75.4% for ModernBERT-large, and 55.8% for Qwen3-0.6B.
The mirror-reversal diagnostic further tests physical position rather than document origin. Documents are split into five segments and reversed, so front-origin evidence moves to the back and back-origin evidence moves to the front. The reversal front-back gap \(\Delta_{\mathrm{rev}}=\mathrm{B{\to}F}-\mathrm{F{\to}B}\) is positive when the model favors currently front-placed evidence. For Qwen3-0.6B, \(\mathcal{M}_B\) has \(+0.236\), \(\mathcal{M}_E\) has \(-0.230\), and \(\mathcal{M}_U\) drops to \(+0.039\). This mirrors the main conclusion: the concentrated training configurations prefer their trained physical positions, while uniform training is less position-sensitive.
Representation-Level Analyses
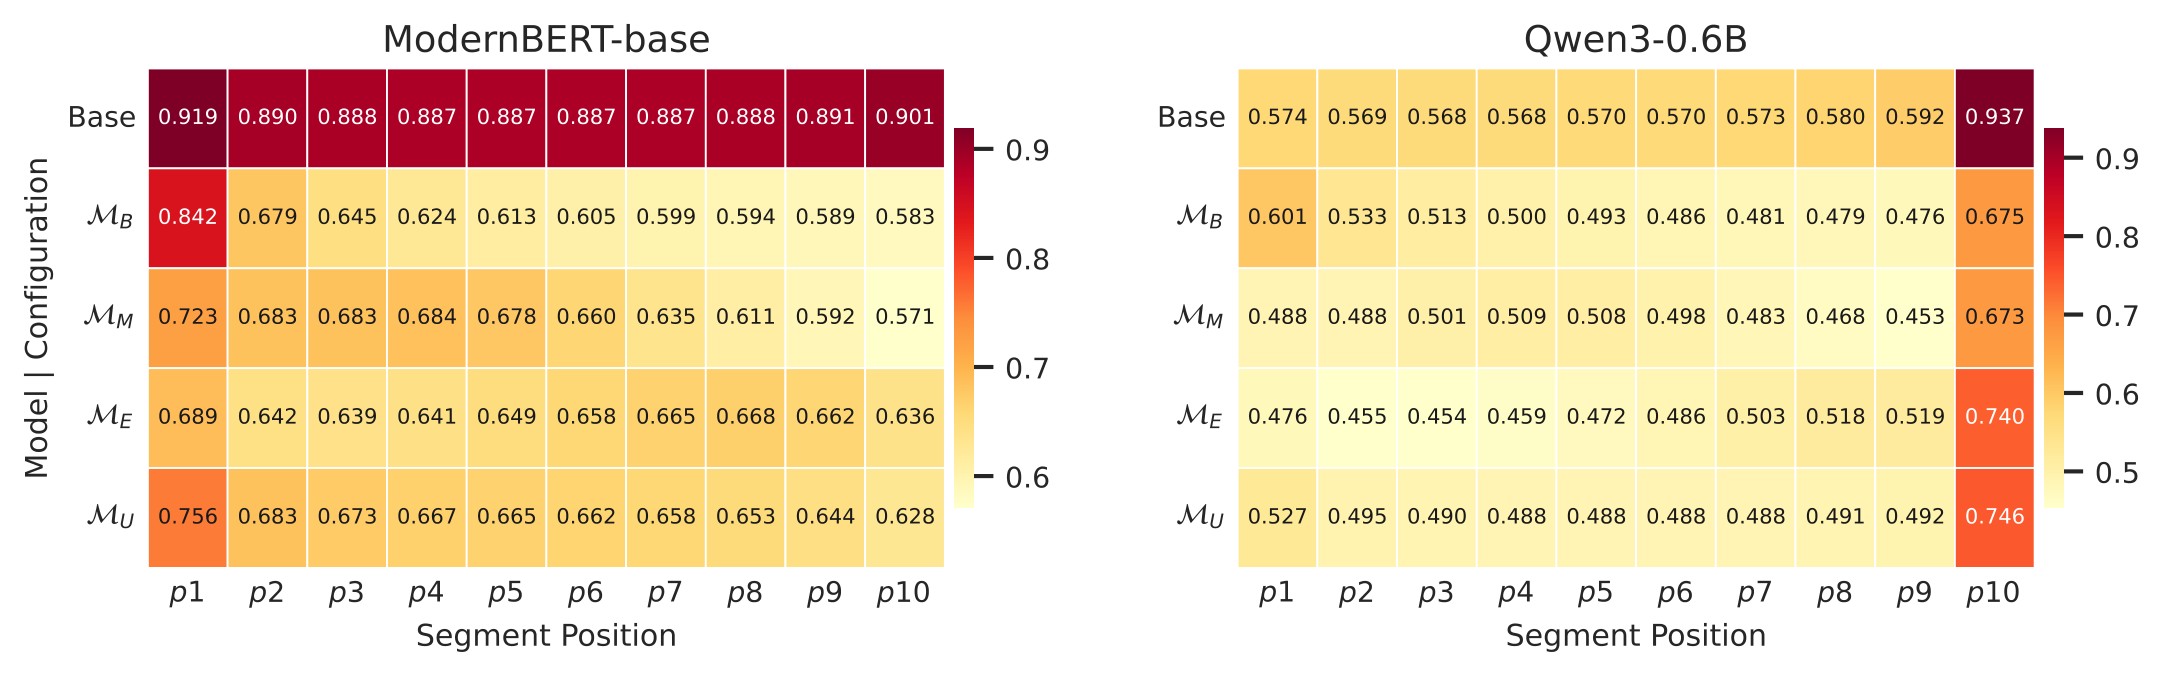
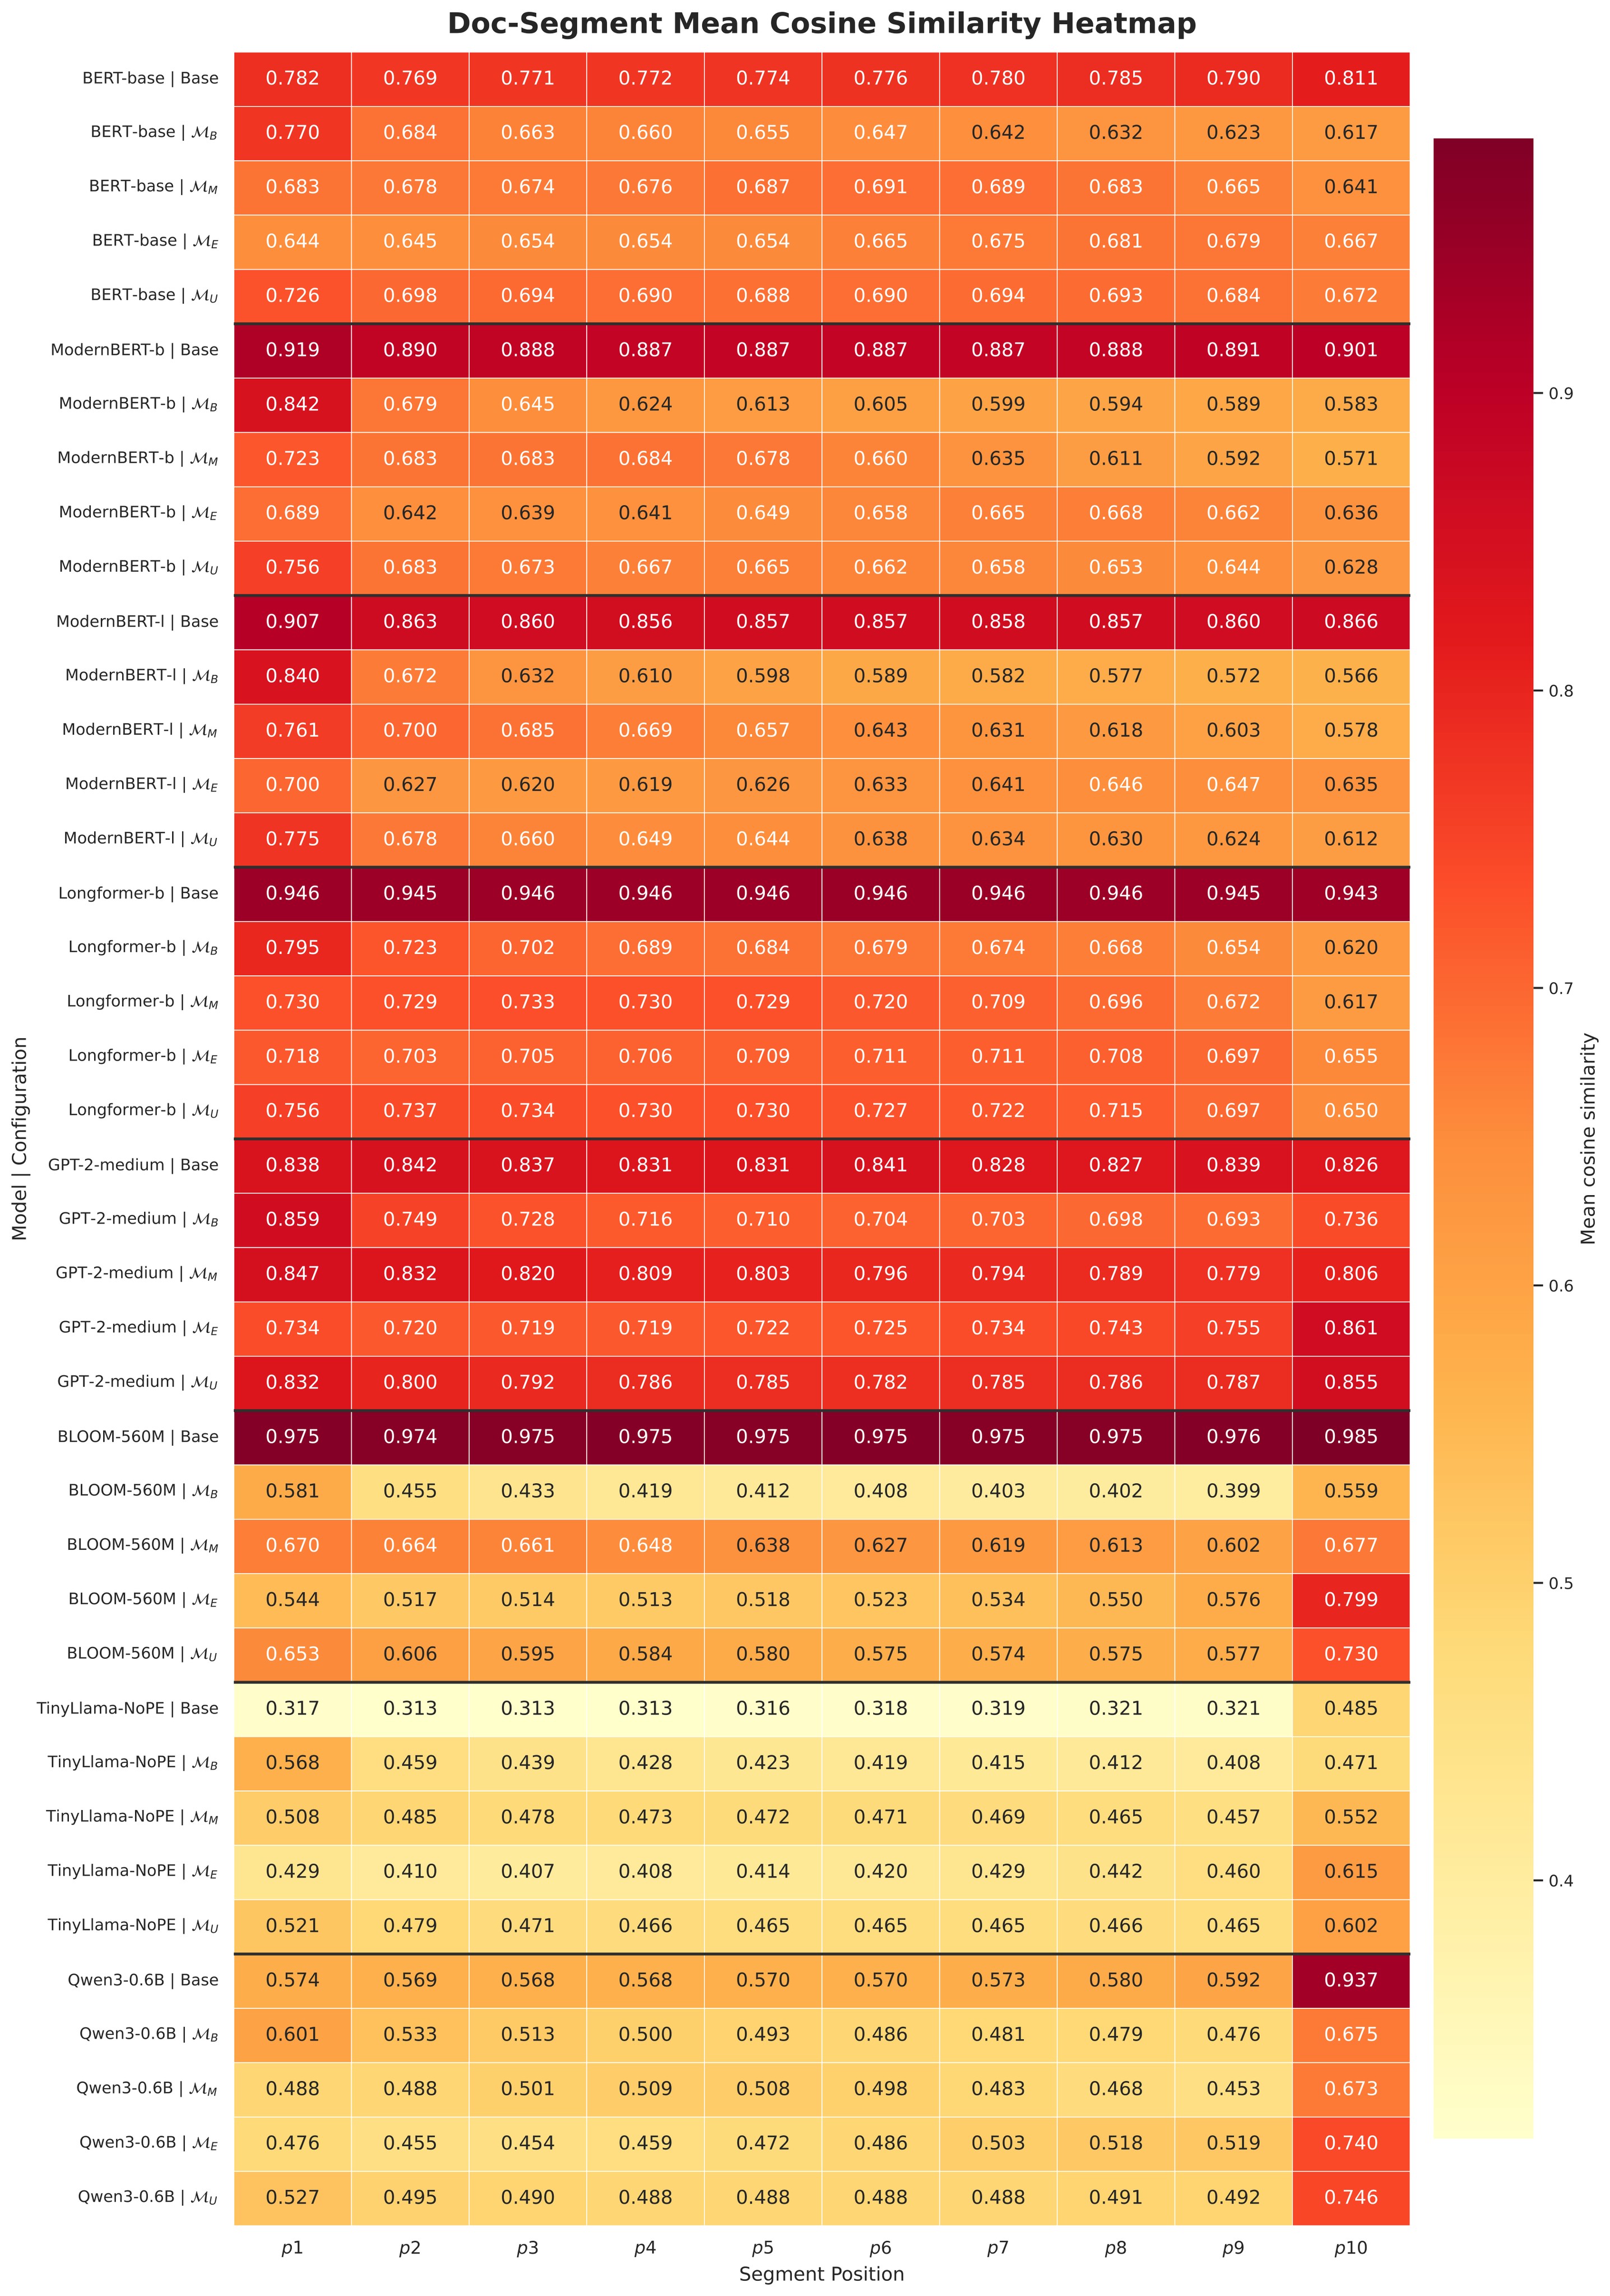
The paper then asks whether the ranking-level pattern appears inside embeddings. The evidence-moving experiment relocates query-relevant evidence to ten uniformly spaced positions inside the same document and measures query-document cosine similarity. Table 4 shows that the highest-similarity insertion position tracks the training configuration for ModernBERT-base and Qwen3-0.6B.
| Model | Config | Peak position | Lowest position | \(\Delta \times 10^3\) |
|---|---|---|---|---|
| ModernBERT-base | \(\mathcal{M}_B\) | 1 | 9 | 21.2 |
| ModernBERT-base | \(\mathcal{M}_M\) | 4 | 10 | 9.4 |
| ModernBERT-base | \(\mathcal{M}_E\) | 9 | 1 | 20.6 |
| ModernBERT-base | \(\mathcal{M}_U\) | 10 | 2 | 1.9 |
| Qwen3-0.6B | \(\mathcal{M}_B\) | 1 | 10 | 21.5 |
| Qwen3-0.6B | \(\mathcal{M}_M\) | 5 | 10 | 27.1 |
| Qwen3-0.6B | \(\mathcal{M}_E\) | 9 | 1 | 20.6 |
| Qwen3-0.6B | \(\mathcal{M}_U\) | 9 | 10 | 5.5 |
Table 4. Evidence-moving cosine analysis. Uniform training sharply reduces the peak-minus-lowest gap, especially for ModernBERT-base, but does not make all representation behavior perfectly flat.
The document-only analysis tells the same story. In Figure 4, ModernBERT-base and Qwen3-0.6B show only mild pretrained tendencies before retrieval fine-tuning, then shift toward the position emphasized during fine-tuning. Figure 5 gives the broader all-model view.
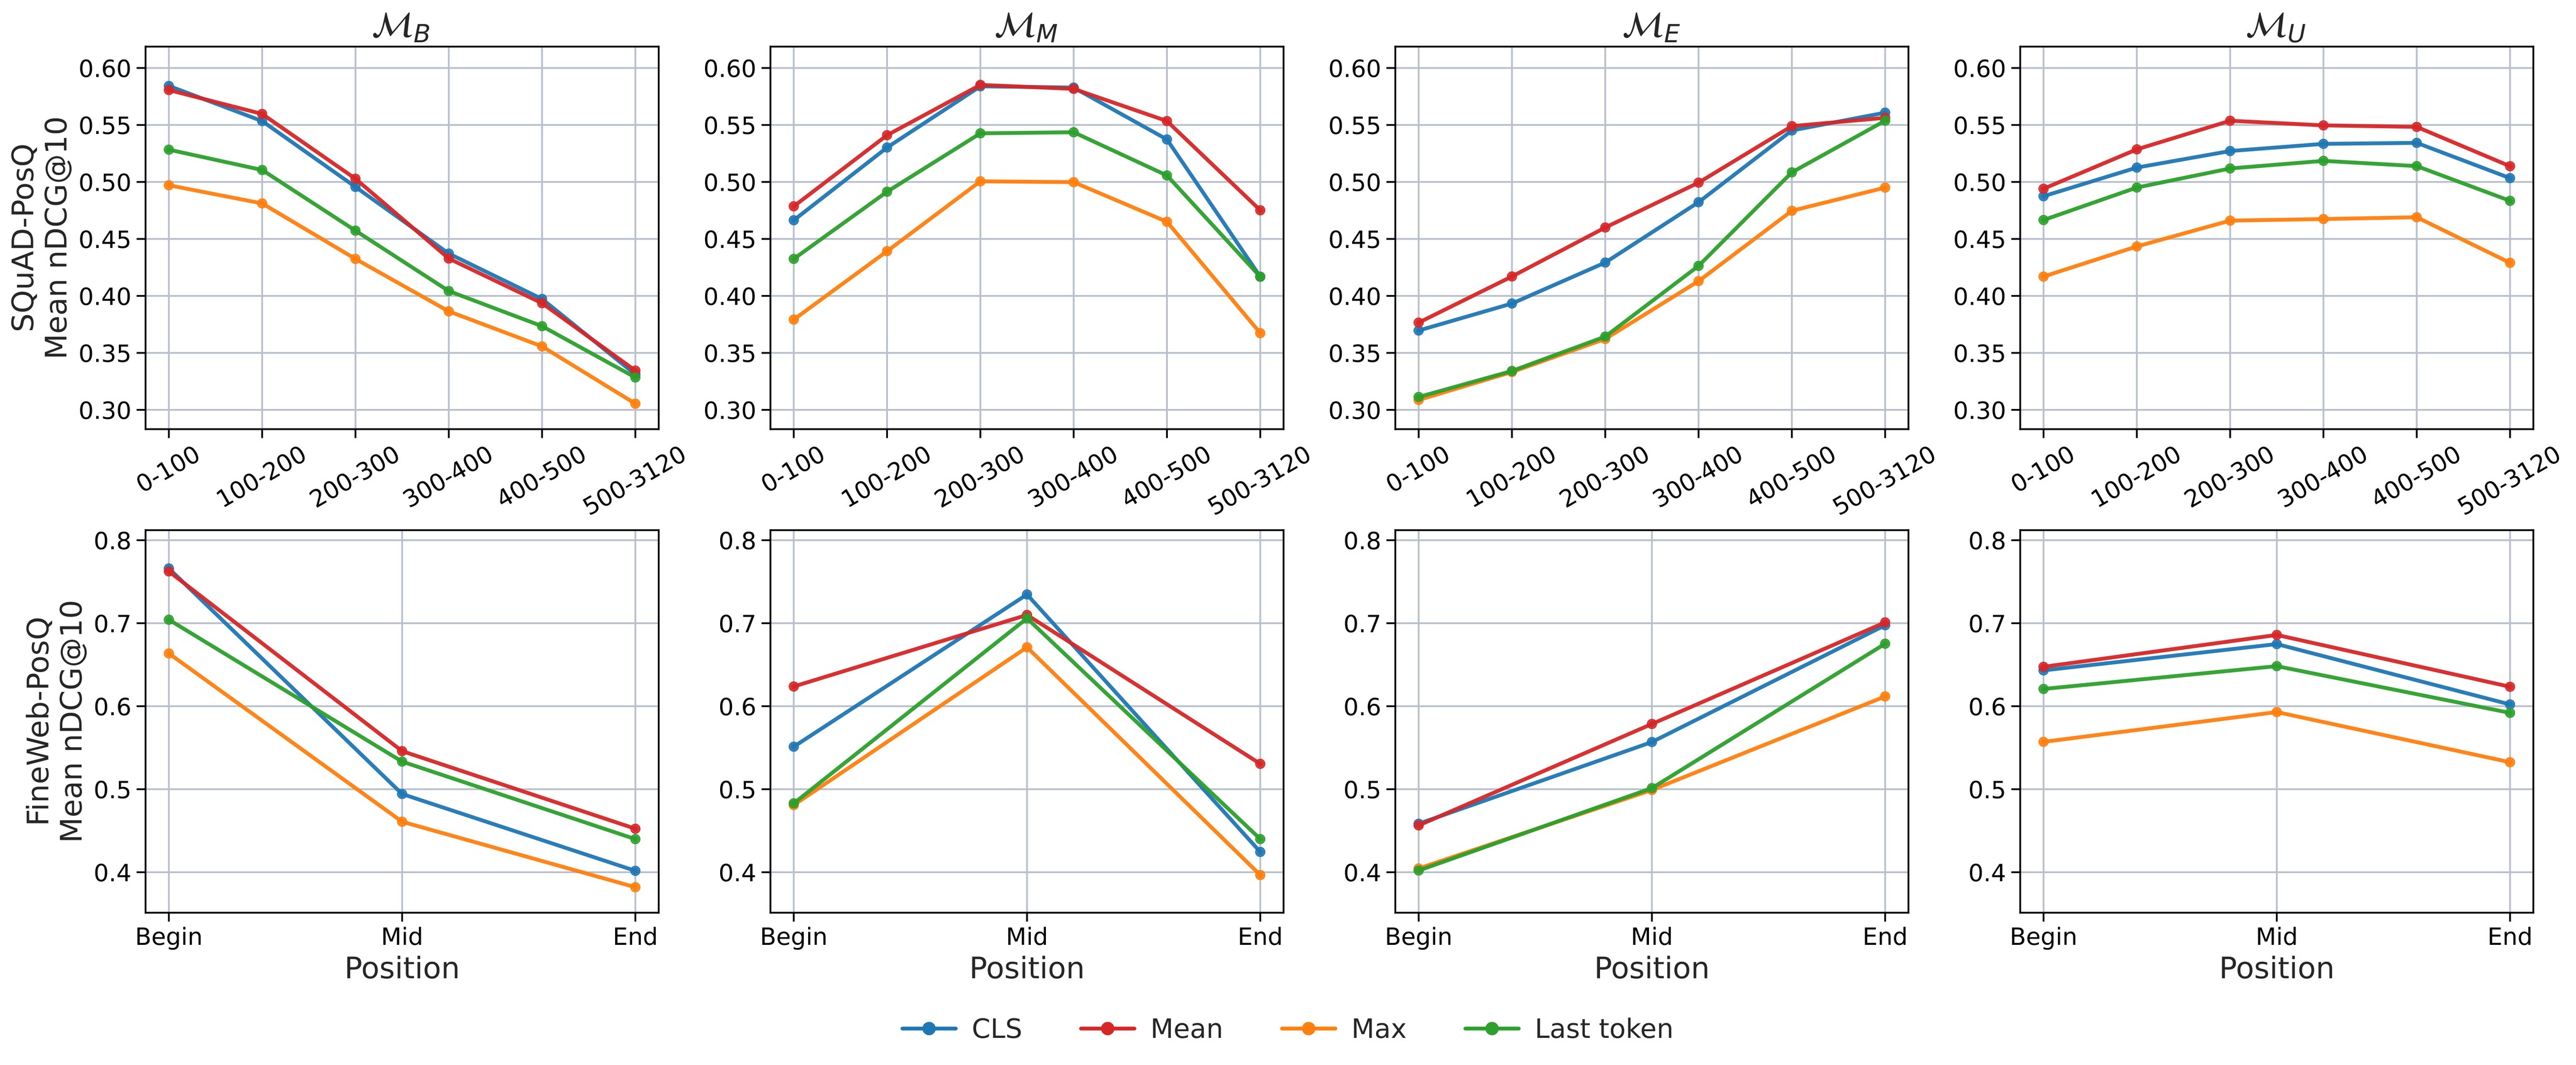
Finally, Figure 6 checks whether the effect is an artifact of a single pooling choice. For ModernBERT-base, the paper trains the same four positional distributions with CLS, mean, max, and last-token pooling. Pooling affects absolute performance, but the direction of position preference still follows the training-position distribution.
Practical Takeaways
- For retriever training, evidence-position balance is a practical mitigation lever. The strongest result is not that one architecture is robust, but that balanced evidence positions consistently reduce PSI across diverse retrievers.
- Standard retrieval benchmarks can hide or even reward position bias. If a benchmark's relevant evidence tends to start early, begin-trained models can look better without being robust to later evidence.
- The result is most relevant to RAG pipelines that retrieve long documents or passages with non-front-loaded answers. Data curation should check where evidence appears, not only what topic or domain the text covers.
- The paper's causal claim is strong inside its controlled synthetic setup, but it does not prove that physical position is the only cause. Segment content, discourse role, generated-query semantics, and difficulty can still be entangled.
- The training data is filtered by rerankers and audited by an LLM, not human annotated. The audit is useful evidence, but it is still model-based validation.
- The experiments are single-seed, omit hard-negative mining, and evaluate retrieval-level behavior rather than end-to-end RAG. Follow-up work should test multilingual, domain-specific, human-validated, and downstream QA settings.
The limitations section explicitly cautions that beginning-, middle-, and end-targeted examples use different target segments and generated queries. It also notes residual labeling errors, possible verifier-induced biases, single-seed training, limited hyperparameter exploration, and no end-to-end production retrieval evaluation. Those caveats are important: the paper identifies training-position distribution as a major controllable factor, not as the only factor behind dense-retriever position bias.